A nine game Thursday board includes just three evening games, not enough for a large daily fantasy notes section.
To be honest, I don’t know what this is going to look like. It may be 18 one liners, but we’ll probably find something to dig into, whether it’s actionable or not.
On a happy note, it’s nice to finally hit a big one with the Tigers yesterday. Scored seven in the first and not one more the rest of the game, but held Houston to just a two run home run in the middle innings. I believe that’s only the second larger than one unit play we’ve hit this year. It’s otherwise been a lot of break even most of the week, which is not a terrible thing.
All stats through Tuesday. Legend at the bottom of the page.
If you find the information on this site helpful, the tip jar is open at mtrollo86@gmail.com on Paypal.

Athletics @ Twins
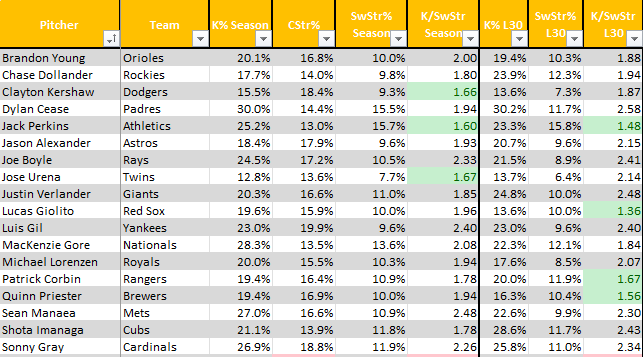
In a starting role, Jack Perkins has allowed 10 runs over 14 innings, but with a 14.5 K-BB% (15.6% out of the pen) and just a 30.8 HardHit%. His velocity has been in the 93 mph range, a bit below average, but with a 15.3 SwStr%. The caveat is that he’s faced a pair of strikeout prone offenses (Angels, Orioles), but also the Diamondbacks. Fastball, slider, cut, change in that order and the one he throws the most grades extremely poorly, while the others have been good and the slider elite by both pitch modeling systems. The strand rate is usually something that corrects itself, but with improved command, this kid could be dangerous.
This is our only unconfirmed spot for Thursday. Roster Resource lists Jose Urena, who is the epitome of giving up.
If Urena is confirmed and the line remains in a similar spot around even or better, I’d certainly have interest in the A’s again for the many of the same reasons I’ve played them in the first two games.
Rangers @ Royals
The party’s over for Patrick Corbin, who has allowed 13 runs over his last 9.2 innings (three starts) with a -3.8 K-BB%. Yeah, it’s been the Yankees, Phillies and Blue Jays, but his cutter grades have dropped to 48 (PitchingBot) and 84 (Stuff+) over that span with marks of 62 and 108 on the year. It’s been the pitch that saved his career, so he better find a way to fix it if he wants to remain around.
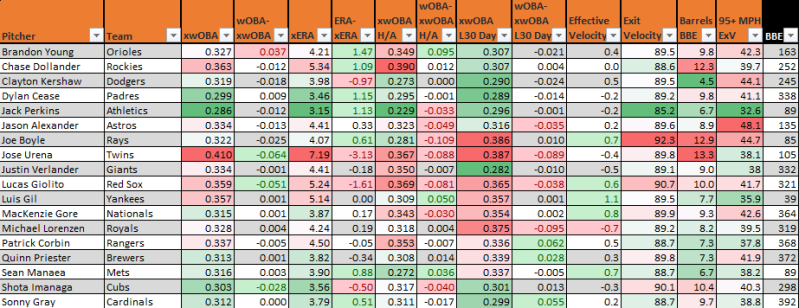
Michael Lorenzon’s 4.43 is right where it’s supposed to be, according to estimators within one-third of a run. The only one outside that range is a 5.08 dERA (which I personally trust the least).
Brewers @ Cubs
The K-BB has dipped back down for Quinn Priester, in single digits in three straight starts before a strong effort last time out, but even if he take his season mark (11.7%) at face value, he continues to generate ground balls (58%), which have kept the barrel rate low (7.3%) with a 41.7 HardHit%. Pitch modeling, well Pitching Bot specifically, doesn’t like him, but when you consider 17 of his 27 barrels have turned into home runs, remaining estimators range from a 3.50 dERA to a 3.93 SIERA, just a bit above his 3.48 ERA.
Three straight quality starts for Shota Imanaga, but more importantly, he’s struck out 30 of his last 91 batters with just two walks, all against different divisional opponents. He’s still allowing barrels at a double digit rate, part of his elevated contact lean (28.6 GB%), but all of his estimators have dropped below four and a half now with pitch modeling and an xERA around three and a half, still half a run above is actual results (3.06 ERA), due to a completely unsustainable .218 BABIP and 85.4 LOB%.
In a neutral weather game, I’d probably have some over leans here, but I need to see what the wind’s doing first.
Dodgers @ Rockies
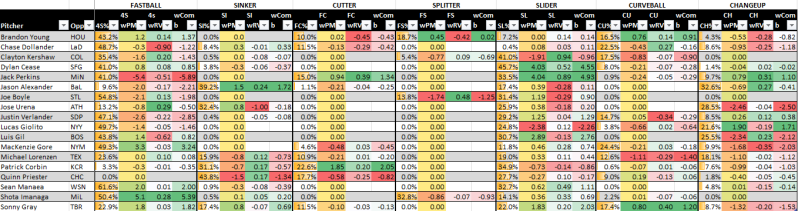
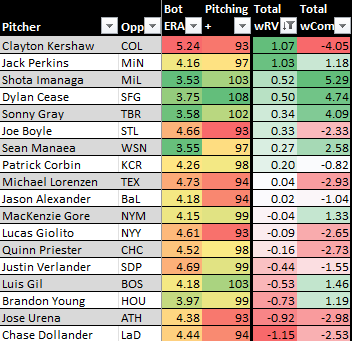
Clayton Kershaw has three straight quality starts with a total of two runs allowed, while striking out just 10 of 67 batters. Take a look at the last image on this page. Granted, it’s a nine game board, but I don’t think I’ve ever seen it where a pitcher tops the pitch matchup ratings by pure run value, but drops to the very bottom of the board when including pitch modeling. That’s a pretty decent indication that Kershaw may be doing something unsustainable. If you listen to the voices on MLB Network (aside from Brian Kenny), they’ve already said, well, he’s doing it and his name is Kershaw, so it must be sustainable, but even though we haven’t played the game at that level, we know different. For one, his 9.2 K-BB% is more than two points below last year, half the year before and less than half his career average. This is unknown territory for him. Point in his favor, the 49.8 GB% is his highest in a non-pandemic season since 2016 and that’s allowed him to keep the barrels to a minimum (4.5%), even with a 44.1 HardHit% (his career worst was 40.8% last year). The rest of it is not as bad as his pitch modeling, but a 3.98 xERA is Kershaw’s only estimator below four. You might say that Kershaw has great BABIP, LOB% and HR/FB numbers through out his career. Sure, some of the best ever produced. That’s why he’s a Hall of Famer in six years, but those were built when he was a much different pitcher. Clayton Kershaw is now a league average pitcher at best and there are worse things to be in your 18th season in the league, but he’s being treated as if he’s still a shutdown pitcher when he’s not.
Chase Dollander didn’t fare any better in the minors than he did in the majors, but they brought him back anyway. He’s allowed six runs (five earned runs) in 9.2 innings since, walking five of 46 batters, but at least striking out 11 with a 12.3 SwStr%, which is 2.5 points up from his season rate. He’s also allowed just a 30% hard hit rate over his last two starts, so maybe there is something going on. The velocity (98.5 mph average in both starts) is up over half a mph from his season average. He’s been around 98 mph for the latter half of his starts this year, but these are his two hardest thrown games all year. Thus, nearly all of his pitch grades are up since returning (3.64 Bot ERA, 105 Pitching+). I’m not getting excited yet, but let’s see.
To start with, I’m either an idiot or genius depending upon the result, but I mentioned looking for the Rockies above +250 on Wednesday after the line rose on both Monday and Tuesday, but then was so busy, I completely forgot about it. I’m going to lock this one in early at +232 because I think it actually has a chance to drop. Kershaw isn’t fooling people who study the numbers. In fact, his 4.37 SIERA over the last month is the same as Dollander’s 4.38 in his two starts since returning. Other reasons, again, are a poor Dodger bullpen and defense. Better than Colorado’s in both cases, but still not enough to be a massive road favorite in this instance. Follow RockyJade on Action Network for more.
Mets @ Nationals
Sean Manaea has allowed four runs in five innings or less in each of his last two starts and perhaps he’s not entirely healthy. The velocity has fluctuated and I believe he has some bone chips in his elbow that may need to be cleaned up, but his velo has been a steady 92 mph in his last two starts, about what he averaged last year and he’s struck out 12 of 44 batters with three walks. Manaea is up to a 21.9 K-BB% with a solid contact profile. The problem has been that all six of his barrels have left the yard. All of his non-FIP estimators are below four, most in the mid-threes. I have confidence in this improving.
Mackenzie Gore K-BB%
First 14 starts: 28%
Next start: 15.4%
Next 8 starts: 3.3%
Last 2 starts: 30.4%
It’s a similar hot start, swoon and then reemergence as last season, but for different reasons.
You have more time to look at some things you normally wouldn’t on fuller slates. Notice how poor the Washington defense has been this year, but how good this particular projected lineup (and I may be wrong) against Manaea is.
Giants @ Padres
A full mph below his previous seven starts (93.9 mph vs 94.9), Justin Verlander pitched his best game of the season against the Rays last time out. He completed seven (for the first time) shutout innings on just two hits without a walk and eight strikeouts (most since second start). He does have a 23.9 K-BB% over his last four starts and has been at at least 19% in seven of his last 11 starts. That’s something. Even if I’m not buying that he’s back in his prime again, it’s nice to see that he still has something left in the tank. It’s actually pretty odd to see him have a normal split this year (28 points wOBA, 12 points xwOBA), but one of the more entertaining things about watching a pitcher who was as great as he was in his decline is that he’s reaching numbers and milestones we won’t see again for a long time after he and Scherzer retire.
Dylan Cease has walked five (Mets) and six (Dodgers) over his last four starts. He’s still rocking a 20.2 K-BB%. Previous four years: 20 K-BB%. His barrels are up a bit (9.7%), but the real difference has been a .313 BABIP exactly 50 points higher than last year and 20 points higher than his career rate. He’s surprisingly been a low strand rate guy (72.4% career, 69.4% each of previous two years, 67.2% this year). Maybe it’s the walks, but it’s weird that he sequences in such a sub-optimal way that almost no other pitcher does. Yet, it’s been consistent.
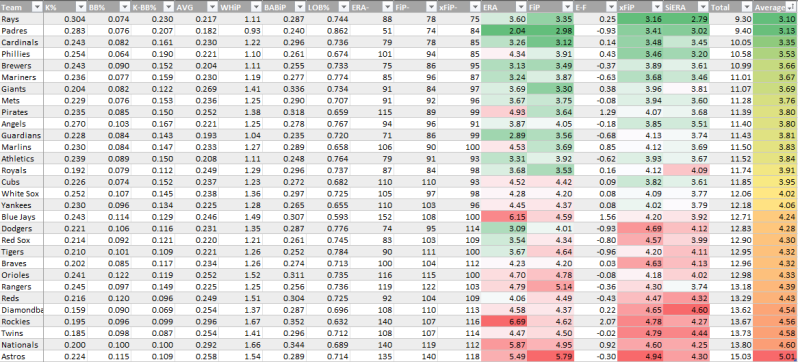
Bullpen stats L30 days...
Astros @ Orioles
Three straight quality starts with a total of two runs allowed for a 32 year-old pitcher I can’t recall ever seeing pitch a good game before. Jason Alexander has struck out 15 of 66 batters with four walks over this span and has a 17.4 K-BB% if you add a fourth start, but is still at just 8.9% on the year and he’s been doing this with an 8.8 SwStr% that’s lower than his 9.6% season mark, along with a 50% hard hit rate. I’m not really buying it. Strange that some consider the changeup (55 PB grade, but just 82 Pitching+), but LHBs have pummeled him (.344 wOBA, .364 xwOBA).
Eight innings of one hit ball without a walk and six strikeouts in Houston Brandon Young’s last time out. It’s been my experience (and I don’t have the numbers to back it up) that when a poor pitcher comes out of nowhere to throw a no-hitter or come very close, it’s generally more of a blip than a career altering turning point, but Young is a rookie and a not terribly regarded prospect (45 FV grade), so who knows? He has only one other quality start (also tying a season high six stirkeouts) against, who else but Toronto, of course. He had his heaviest slider game of the season in Houston (25.8% vs 7.2% on the season), yet neither PItchingBot, nor Pitching+ register a slider for that game. They do have a much stronger overall grades (3.54 Bot ERA, 106 Pitching+) than his season rates (3.97, 99) for his start in Houston though. I’m not immediately seeing anything, nor have I read anything suggesting this is the start of a breakout, but who knows? Maybe people who have spent more time looking at him than I.
The Astros are spiraling. A 16 wRC+ over the last week and they didn’t do much to improve it on Wednesday, while recent roster additions have allowed the Orioles to stack a lineup with LHBs against Alexander. Meanwhile, Houston can’t really exploit Young’s .397 wOBA, .348 xwOBA against LHBs. Overall, I have these two pitchers pretty even, but the Houston bullpen is also spiraling with the loss of Hader with the worst estimators in the majors over the last month now, almost half a run worse than the next worse bullpen. It’s all pointing towards the O’s (-110).
Red Sox @ Yankees
Three of Lucas Giolito’s last four starts have been single run quality starts over 20.1 innings. The other one: six walks. He’s allowed one run or less in 11 of his 19 starts, but at least four in seven of the other eight. The underlying numbers are not kind overall (4.30 FIP – 5.24 xERA).
Three starts for Luis Gil. His velo dropped from 96.4 mph in each of his first two to 95.7 last time out. He’s had command issues in each of his two road starts in Miami and St Louis (seven walks, seven strikeouts), while striking out seven of 22 Astros (who’ve been spiraling as we mentioned) with one walk in his lone home start in between. His league average pitch modeling is very much in line with last season.
Below, these last two graphics are pitch matchup ratings, explained here. It uses pitch frequencies and run values both for the pitcher and the opposing offense and then attempts to add in pitch modeling, which sometimes differs from actual results.
Cardinals @ Rays
Sonny Gray has a 5.17 ERA and 25.2 K-BB% over his last 10 starts. It’s not the 36.7 HardHit%. Maybe the 10.8% Barrels/BBE, but mostly the .336 BABIP and 58.1 LOB%. His 3.58 Bot ERA and 3.79 xERA are his only estimators not more than a run below his 4.30 ERA this season.
Joe Boyle has averaged above a 99 mph velocity in three of his last four starts, but it’s not helping him. We’ve seen more bad (17.4 BB% over that span) than good (23.2 K%, but 8.7 SwStr%). Boyle has allowed nine barrels (22.5%) with a 50% hard hit rate during this four start stretch.
LEGEND
Opp wRC+ Opposing offense’s wRC+ against L/RHP this season (in first graphic)
DEF Projected lineup(Roster Resource) Fielding Run Value & Team Runs Prevented now both in first graphic
Bullpen SIERA/xFIP/FIP average over the last 30 days (because there’s so much bullpen turnover)
BSR: Projected Lineup Base Running Runs also in first graphic
Don’t hesitate to ask about anything else that’s unclear.
Follow @FreelanceBBall on Twitter and Bsky.app
Add comment
Comments