I've spent a large portion of the last couple of weeks thinking about how certain pitches match up against certain teams. You can see it's what teams are thinking of too, as no longer do most of them just stack batters from the other side of the plate against a pitcher and call it the platoon advantage. Teams are recognizing reverse splits, which are often based on individual pitch selection. Earlier in the year, I heard the Mets talking about matching hitters up with the opposing pitcher by swing plane.
With so many pitches (Seth Lugo throws nine by himself), my limitations were in what I could fit in a single page view. I was able to break it down to seven main pitches:
- Fastballs (four-seam)
- Sinkers
- Cutters
- Spiltters (includes Kodai Senga, the only pitcher with a forkball grade)
- Sliders (includes sweepers)
- Curveballs (includes knucklecurves, which was easy enough to do because I don't think anyone throws both)
- Changeups (the newly popular kick change is not differentiated in classifications)
Knuckleballs, screwballs and whatever else, nobody throws enough to be worried about. Slurves may end up being an issue, but we'll see.
The criteria I was looking for first was run value. Individual pitch run values and opposing team run values against each pitch. It's not perfect, but it's what we've got to work with and breaking it down to individual hitters is too large a project for me at this time.
Because run value doesn't tell the entire story, I've also looked for a way to fold in pitch modeling. I had a great analogy in Aaron Nola's curveball (or knuckle curve) the first day I ran this, but Landon Roupp's sinker serves to illustrate the point nearly as well. His run value on the pitch he throws 41.2% of the time says it's a poor pitch. However, the PitchingBot grade and Pitching+ both say it's a positive for his arsenal.
Let's start by showing you the raw data I've collected, which is really self-explanatory:
- Pitcher
- Opposing Team
Then, on the individual pitch level
- % thrown
- PitchingBot pitch grade
- Pitching+ pitch grade
- Pitch run value (pitcher - positive is good for the pitcher)
- Pitch run value (opposing offense - positive is bad for the pitcher)
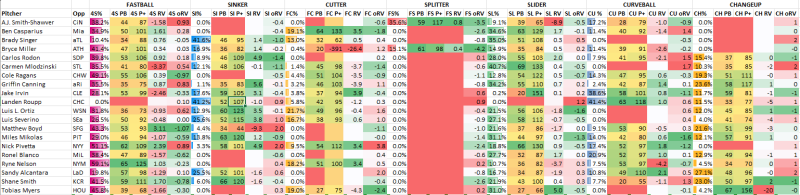
I realize this is a large image with small numbers, but it's what we have to do to get seven pitches on the page. That's all the information I was working with and I could have left it at that and just talked about it, but I wanted to break it down (or combine it rather) and come up with some kind of matchup rater?
The first part was easy. Pitch run value minus opposing team run value on each pitch (because positive is good for both pitchers and hitters) multiplied by how often each pitcher threw that pitch.
For example: Cole Ragans has a 0.39 wFA/C, while the White Sox as a team have a -0.97 wFA/C (C represents per 100 pitches). 0.39 - (-0.97) = 1.36 wFA/C (a positive number, which is good for Ragans).
But I'm not looking for just one individual pitch. I want to break it down for the pitcher's entire arsenal, so I multiply that 1.36 by 0.491 (how often Ragans throws that pitch) and came up with a combined matchup run value of 0.67 on the fastball.
I then went and did that for every individual pitch for each pitcher on the slate that day and I could have added all of those up and that would have been it and that's what you got in the Total wRV column I posted at the bottom of Monday's article in the next to last column.
--
Now for the pitch modeling. I didn't want to favor one over the other, but they were on different scales and don't always agree. One grades at a 50 average, the other at 100. I did a little manipulation and put them on the same scale with average at 0.
For example: Cole Ragans fastball has a 55 Pitching Bot grade and 106 Pitching+. That became 5 (55-50) and 3 ((106-100)/2)). Why did I divide Pitching+ by two? I believe it's twice the scale of PitchingBot (ie 120 via P+ = 60 via PB). This could be wrong and I never took statistics. You divide by 2 and Cole Ragans fastball grade is 4 (which is pretty solid, though not the best on this slate - Ryan Nelson gets to 13.5 in a more limited sample). Lastly, I then multiplied that by how often Ragans threw the pitch (0.491) and came up with a weighted pitch modeling score of 1.9 on the fastball for Ragans.
Here's what everything I just talked about above looks like for Monday's slate for every pitcher's fastball rounded to the nearest full number for pitch modeling until we multiply by % thrown:
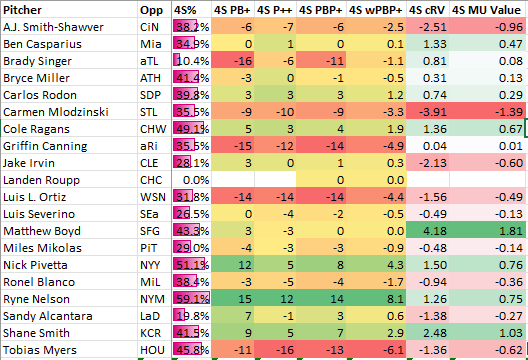
Here's a further explanation if it's still unclear. Matt Boyd's Pitching Bot fastball grade is 53, scaled to 0 it becomes 3. His Pitching+ is 93, scaled to 0 is 7, divided by 2 is 3 (you can go decimals deep in pitch grading, but I'm rounding to nearest whole number, so actually was (93.452827 - 100)/2 = 3.3). Conveniently, the two new pitch modeling grades average out to zero, which is obviously still 0 when we multiply it by 43.4%. Next, his fastball has a run value of 3.11 wFA/C. This comes straight from Fangraphs Statcast section on PitchValue/100 (which seems to differ from BaseballSavant's Run Value for some reason I can't understand). The Giants are terrible against fastballs (-1.07), which gives us a positive pitch value of 4.08 wFA/C for Boyd's fastball when the numbers are combined. Multiply that by how often he throws it (43.3%) and you have the pitch valued somewhere around 1.81 run value for the game, which so happens to easily be the largest positive number on this slate.
Now I have two numbers for each pitch a pitcher throws: combined run value weighted by how often the pitcher throws that pitch (1.81 for the fastball in Boyd's case) and combined pitch grade weighted by the same (0 in for the fastball in Boyd's case).
What do I do with them?
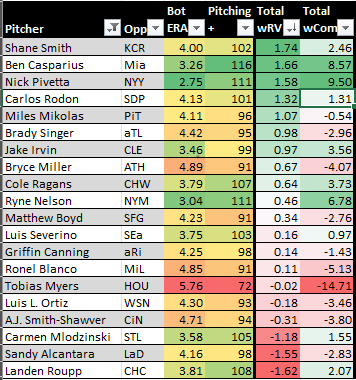
My initial thought was to simply add the two numbers together and that's the last column in the graphic I posted in Monday's article.
I immediately regretted that decision. It made pitchers with strong pitch modeling grades stand out no matter how tough the matchup. It happened with Schwellenbach against the Dodgers on the first day I ran it and with Pivetta against the Yankees on Monday.
In fact, and I'll post it again, the only other pitchers who came close to Pivetta were Casparius and Nelson, both who have been working out of the bullpen. (This is not going to recognize sample size issues, but I trust the readers to do that. You're not reading something like this if you're not keeping up on the game.)
Then again, Pivetta resides only behind Casparius's small sample on pitch values alone, before we even get into the pitch modeling. There are many people who could weight these things better than me, but I'm very likely to alter the pitch modeling influence in the near future.
Here's the grid I posted yesterday and then the entire thing broken down by pitch following it. The five colums are % thrown, weighted pitch modeling number (scaled to zero multiplied by how often the pitch is thrown), combined run value multiplied by pitch usage and then (for now) a combination of both in the last column,
If you're not interested in pitch modeling (and maybe because I'm not sure how to include them yet), then focus on the pure run value column, which I have sorted by here.
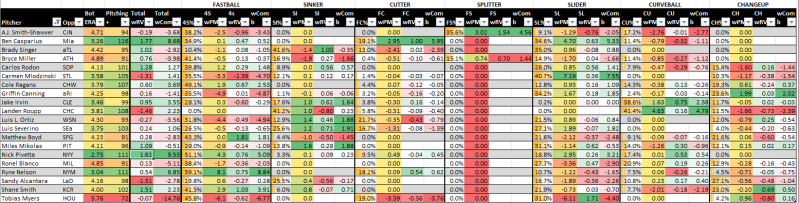
Apologies, but I don't know how to make this image any smaller or the numbers any larger. It's either post all seven pitches or none at all. Perhaps I can remove the last column for each pitch, which simply adds the weighted grade to the weighted run value. If you pop out the image on a new tab, you can see it near actual size.
There are several caveats and important notes though.
I'll repeat again, small sample sizes are going to stand out here. Not in the pitch modeling, but in the run values. This works for pitchers (like the two relievers we see here today) as well as offenses. Look at that splitter column and to a lesser extent the cutter (we actually have a larger portion of the pitchers throwing cutters here than I would imagine would be usual). These pitches aren't thrown often enough that teams would have large sample sizes against them, so the run values are going to be larger (either to the positive or negative) than other pitches.
Pitch modeling should tighten up more quickly and not have that particular issue, though relievers converting to starters may see their pitch modeling suffer in the conversion.
Now that I've done all this work, I'm going to tell you that it's never going to be accurate.
Cole Ragans averages 49.1% fastballs per start, but has never actually thrown that exact percentage in a start this year. He's been pretty close, but even only off by 0.5 percentage points or less twice in six starts.
Pitchers always determine what pitches they throw, either by what is working for them that day or the opposing team's weaknesses, while hitters never determine which pitches are thrown to them. When you see a pitch matchup strongly favoring an offense, the pitcher can usually just decide not to thrown that pitch as often. That may not always happen and sometimes pitchers believe in their stuff against anyone and some offense are just really good against every pitch a pitcher throws, but it's always a pitcher's choice on how to play this out.
Lastly, offenses do have some recourse. They can (and as I mentioned much earlier in this article) and now often do sit players who don't match up well with pitchers based on other things than being right or left-handed. There are a few guys on every team who aren't coming out of the lineup no matter who is pitching, but the latter half of most lineups will have some wiggle room to improve these matchups on most days.
Use this as a guide to help inform or enforce opinions (hey, this team may not like what this guy throws). Don't put too much emphasis on it.
Add comment
Comments