The Friday format covers games/pitchers of interest with daily fantasy notes in the early afternoon. It’s now Thursday evening, around 7pm ET and we still have five TBDs on MLB.com, which almost makes me want to skip the entire thing, but we’ll use Roster Resources best guesses to get as far as we can.
All stats through Wednesday. Legend at the bottom of the page.
If you find the information on this site helpful, the tip jar is open mtrollo86@gmail.com on Paypal.

Reds @ Cubs
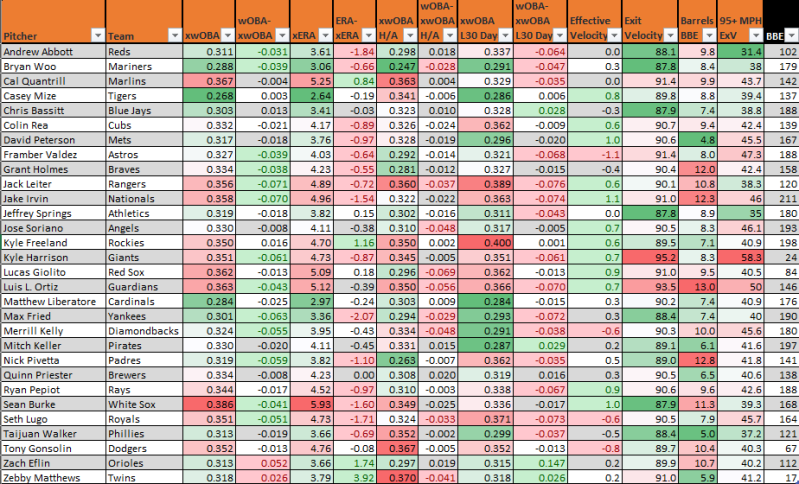
Andrew Abbott has allowed more than one run in just one start with a 92 LOB% and 10.5 SwStr% that matches his walk rate (10.3%) and barely supports his strikeout rate (27.3%). He has awful pitch modeling, but great run values on those pitches. It’s an enigma.
DEF: -2
BSR: 6
Colin Rea (not confirmed) has similar pitch modeling and a similar pitch matchup rating by run values with estimators averaging less than a quarter run worse than Abbott. The fastball is the only pitch he throws more than 10% of the time.
DEF: 5
BSR: 5
Brewers @ Phillies
One earned run in three of Quinn Priester’s last four, but he just struck out more than four for the first time this year (seven of 24 Pirates). His 4.23 ERA matches a 4.23 xERA and a 3.90 dERA is his only estimator below that.
DEF: 3
BSR: 0
Pitch modeling likes the cutter (55 PB, 116 P+) that Taiuan Walker now favors (27.3%) more than any other pitcher. He does not have another positively graded pitch and it should play well against the Brewers (-0.9 wFC/C). Estimators range from a 3.66 xERA to a 4.91 Bot ERA.
DEF: -13
BSR: 7
I could have interest in Philadelphia’s total (4.5), but want to wait to see if Harper is back. Follow RockyJ Jade on Action Network.
White Sox @ Orioles
Sean Burker has allowed one run or less in four of his last five starts. He has a 36.4 HardHit% with just five barrels (6.5%) over that span, but also a 0.0 K-BB%, .240 BABIP and 83.3 LOB%. A 4.58 Bot ERA is his only estimator below five and he’s near the bottom of our pitch run value ratings.
DEF: -9
BSR: -3
Zach Eflin has not only allowed 13 runs (12 earned) over his last 10.1 innings, but seven home runs on just six barrels, but that’s still 15% of this contact. His velocity has been steadily down a mph from last year, leading to his worst K-BB (9.5%), GB rate (38.7%), Barrels/BBE (10.7%) and hard hit rate (40.2%) since at least 2017 with some of them his worst career marks. His 3.66 xERA and 4.07 Bot ERA are Eflin’s only estimators below four and a half.
DEF: -6
BSR: 1
Look at both their contact profiles. Eflin still has the better K-BB% because he rarely walks anyone, but how is his xERA more than two runs below Burke (3.66 to 5.93)? I don’t argue that Eflin is still the better pitcher, but something is off and it might be the velocity causing it, though it often doesn’t matter as much with guys who start at lower velocities. Still with equally bad defenses and the Baltimore bullpen nearly as bad, I don’t think they should be 2-1 favorites here.

Athletics @ Blue Jays
Jeffrey Springs has allowed eight runs (seven earned) over his last 30.2 innings with just an 11 K-BB%, but 37.4 HardHit%. He did have two of those starts at home, in maybe the toughest park in the league and one on the road against the Dodgers. His command grades simply improved.
DEF: -9
BSR: -3
Chris Bassitt has been fine with a 3.38 ERA (18.8 K-BB%) and not a single estimator even one-fifth of a run removed, though he has had his rough patches and still struggles against LHBs (.373 wOBA this year, .379 with a .368 xwOBA since last year).
DEF: 8
BSR: 1
The two points to make here are that Bassitt’s platoon issues shouldn’t be as much of a problem against the A’s and that while his pitch matchup rating is marginal, he throws so many pitches that he can just find the ones the Oakland batters do have weaknesses against. Butler is the LHB who matches up best against him by run values. Bassitt is a decent value on a strong pitching board, but not one of my top overall arms.
Angels @ Guardians
You know what you get with Jose Soriano. Ground balls (64.7%) without much strikeout upside (17.3 K%). He’s actually slightly better against LHBs, which could help him here.
DEF: -19
BSR: 0
Luis L. Ortiz is the anti-Soriano with a 12.7 SwStr%, but 12 BB% and 49.3 HardHit% (12.3% Barrels/BBE). LHBs have a .309 wOBA, but .362 xwOBA since last year.
DEF: 6
BSR: -1
Rockies @ Mets
Batters have a .430 wOBA and 10.6 K-BB% against Kyle Freeland at home. They have a perfectly average .298 wOBA and 13.6 K-BB% on the road. His 4.70 ERA is his only estimator above four and still well off his 5.86 ERA with a .389 BABIP and 55.2 LOB%.
DEF: -4
BSR: 0
David Peterson has popped at least seven strikeouts four times this year, but has just a 13 K-BB% overall (less than Freeland on the road). A 57.6 GB% keeps his 45.2 HardHit% from hurting more.
DEF: -5
BSR: 2
Let me start by saying David Peterson is my top daily fantasy pitcher on the board overall and a strong value as well in a great matchup in a great park. That said, I don’t mind rostering Freeland as your SP2 as well. Freeland has better pitch modeling and a better K-BB% away from Coors than Peterson overall. Both teams also have equally poor defenses. The line (+300) is too high. I’ve been waiting to see how high these Colorado dog lines have gone, but they’ve actually been dropping overnight lately.
Giants @ Marlins
Kyle Harrison has struck out 11 of 38 with three walks and held his increased velocity at 94.7 mph through 17 batters in his first start. His pitch modeling, which has been elite through a few relief appearances, remained elite in his first start too. Now here’s the elephant in the room. His 58.3 HardHit% (4.73 xERA more than a run above contact neutral estimators). Harrison had a 43.8 HardHit% and 10.8% Barrels/BBE last year too. San Francisco can hide some contact problems that other parks won’t and Miami has been playing more neutrally in recent years. RHBs have a .330 wOBA and .350 xwOBA (there’s that SF park influence) since last year.
DEF: 3
BSR: 2
The Marlins pulled Cal Quantrill at 46 pitches last time out with just three base runners. He was piggybacked for five innings by Jansen Junk. I don’t know if this is a particular strategy they’re going to employ with him now. He hasn’t face more than 19 batters in five straight starts and has allowed just 10 runs in those 21.1 innings with a 14.1 K-BB% and 37.7 HardHit%. Not allowing the opposing offense to see him a third or maybe not even a second time appears to have some benefit.
DEF: -2
BSR: 5
Considering the San Francisco offense is below average and ice cold, while Harrison has had a hard contact problem since last year, I don’t understand why the they are such large favorites (+156). Harrison still has some daily fantasy value at a low price. I don’t expect him to pitch particularly poorly.
Red Sox @ Braves
Three good starts, two poor ones for Lucas Giolito, one of the latter against these Braves (as many barrels as strikeouts – three each). The velocity is fine, the pitch modeling is near average, the results are worse than the estimators (.329 BABIP, five of eight barrels have gone for home runs), but we’re still learning what he’s got after missing last season. So is he.
DEF: 11
BSR: -3
Four of Grant Holmes’ last five starts have been quality starts with two runs or less (16.1 K-BB%, 60 GB%). Despite the elite ground ball rate, he’s still allowed 10 barrels (11.8%) over this span. However, pitch modeling is poor, most estimators exceed his 3.68 ERA by more than a quarter of a run, while replacements for injured Boston players don’t strike out as much. Devers and Abreu have particularly strong pitch run value matchups against Holmes.
DEF: 11
BSR: 5
I’m close to convincing myself this line is too high too (+136), but don’t think Holmes is a terrible value at a reasonable price either.
Cardinals @ Rangers
Matthew Liberatore has allowed 11 runs (10 earned) over his last 47 innings with a 17.0 K-BB% and league average contact profile. A 3.87 Bot ERA is easily his worst estimator, yet he still the second best run value matchup on the board against the Rangers.
DEF: 12
BSR: -4
Jack Leiter (not confirmed) has allowed 18 runs over his last 31 innings with 0.0 K-BB%, 11.6% Barrels/BBE and a 43.2 HardHit%. A 4.03 Bot ERA is his only estimator not more than a quarter of a run above his 4.17 ERA. Batters from either side of the plate are above a .330 wOBA and xwOBA against him in his career.
DEF: 2
BSR: 2
Liberatore is my second favorite DFS pitcher against a Texas offense that has been terrible against LHP (68 wRC+, 27.5 K%). There is no line on this game, but if Leiter is confirmed and the line isn’t near 2-1, I may have a play on the Cardinals as well.
UPDATE: I've played a full unit on BOTH F5 (-135) and full game (-130). This is one of the largest discrepancies I've encountered this year and have STL as a large favorite here.
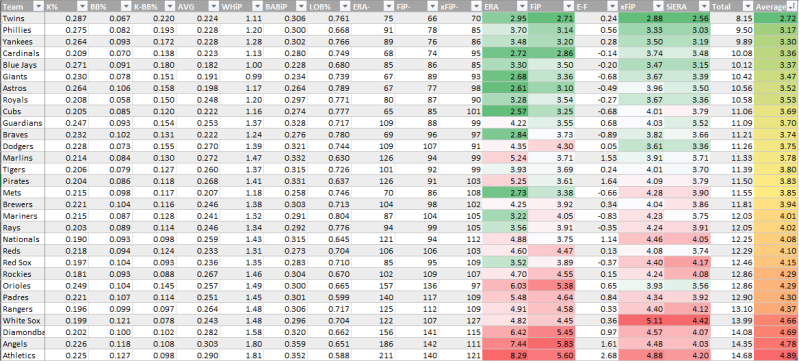
Last 30 day bullpen stats...
Tigers @ Royals
Casey Mize returned from a short IL absence striking out six of 21 Guardians over five innings and is now up to a career best 16.5 K-BB% with his lowest hard hit rate as well (39.4%). He’s throwing more splitters and has developed a curveball that pitch modeling likes as well. In fact, the fastball’s 88 Pitching+ is his only below average grade on any pitch by either system. His 2.45 ERA nearly matches a 2.64 xERA, while Mize doesn’t have an estimator reaching four. He also has one of the top pitch run value matchups on the board with the Pasquash and Sal Perez among his best matchups in that area.
DEF: 1
BSR: -3
Seth Lugo last pitched on May 11th without a rehab start. I expect some sort of limitation. He’s also running a .245 BABIP and 83.3 LOB% that have his 3.02 ERA at least a run below all estimators, including some terrible pitch modeling, despite the positive run values. LHBs are up to a .308 wOBA and .326 xwOBA against Lugo since last year, though no single Tiger stands out against his wide arsenal of pitches.
DEF: 1
BSR: 2
Mize’s worst estimator is better than Lugo’s best, while the Tigers have more than a 20 point wRC+ edge both Hm/Rd and vs RHP. Why aren’t the Tigers more largely favored against a potentially limited Lugo? I split a unit between F5 and full game. Mize is also currently my third favorite pitcher on this slate. The Royals don't strike out much, but boy are they awful.
Rays @ Astros
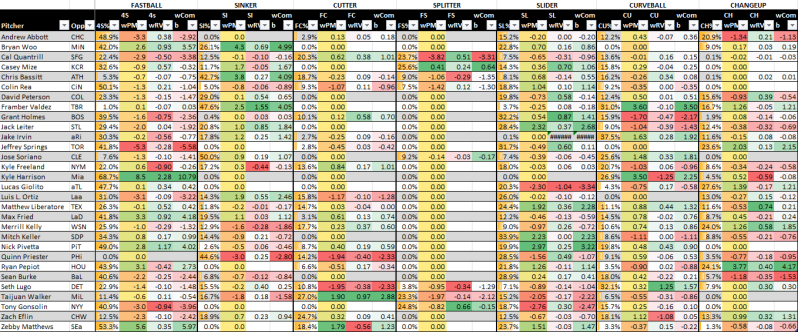
Seven shutout innings on three hits with a walk and five strikeouts for Ryan Pepiot against the Blue Jays last time out. Quality starts in six of his last seven starts, but three of them of the six and three variety and a drop in his K-BB to 11.4% over that span, while also allowing 9.2% Barrels/BBE with a 43.3 HardHit%. With an 81.5 LOB%, his 3.55 ERA is more than half a run below estimators ranging between a 4.08 xFIP to a 4.52 xERA with one exception and that’s where all the frustration comes from. Look at his pitch modeling (2.97 Bot ERA, 110 Pitching+). By actual run values though, the changeup is the only pitch getting results. Batters from either side of the plate are between a .299 and .314 wOBA and xwOBA against Pepiot since last year. Pena, Paredes and Cam Smith have the best pitch value matchups against him with the latter hitting the changeup best. Add in pitch modeling in the last graphic below and Pepiot goes from one of the worst ratings to one of the best.
DEF: -7
BSR: -4
Framber Valdez tied a season high with four walks against the Mariners last time out, striking out only five, but those starts have been far and few between this year. His 14.7 K-BB% matches his career rate and is up to 17.7% over his last five starts. His ground ball rate is up to 62.8% over the same stretch and he needs those ground balls to counter a season 47.3 HardHit% that’s allowed just 8% Barrels/BBE. Contact neutral estimators run within one-fifth of a run of Valdez’s 3.39 ERA. In fact, a 4.03 xERA is his only estimator outside that range. Framber matches up very well with Tampa Bay batters who are not good against sinkers.
DEF: 8
BSR: 2
I believe Pepiot to currently be over-valued, while Valdez is a decent value and strong arm tonight, but neither a top three arm or value for me tonight. In fact, I have him very closely rated to Chris Bassitt and another pitcher I haven’t talked about yet.
Nationals @ Diamondbacks
It appears as if Jake Irvin has bounced back striking out 13 of his last 55 with three walks over 14.1 innings in which he’s allowed just 11 base runners via hit or walk. However, he’s done this with just a 6.2 SwStr%. In fact, he has just a 10.1 K-BB% with 12.3% Barrels/BBE and a 46 HardHit% on the year. While Irvin’s 3.59 ERA nearly matches his actual results (3.42), all additional estimators are well above four and Pitching+ debates PitchingBot on the merits of his arsenal, while he doesn’t match up particularly well by run values against Arizona batters. LHBs have a .329 wOBA and .350 xwOBA against Irvin since last year.
DEF: -13
BSR: 5
Merrill Kelly has spiked a 26.5 K-BB% over his last four starts and is now exactly 10 points below that on the season and his best non-pandemic season mark ever with some contact profile issues (10% Barrels/BBE, 45.6 HardHit%). Pitch modeling does not have much love for him, but all other estimators are within half a run of his 3.52 ERA and Kelly rates well against Washington from a run value standpoint. Since last year, LHBs have just a .298 wOBA, but .348 xwOBA against him.
DEF: 6
BSR: -6
I have Irvin as the worst value on the board and a pitcher I think you want to attack here and it might be a contrarian thought because of his solid surface numbers. I have Kelly barely being the Bassitt/Valdez group. Okay in a good matchup, but not my favorite in a positive run environment.
Below, these last two graphics are my new pitch matchup ratings, explained here. It uses pitch frequencies and run values both for the pitcher and the opposing offense and then attempts to add in pitch modeling, which sometimes differs from actual results.
Pirates @ Padres
Four straight quality starts with a 21 K-BB% for Mitch Keller (13.9% season). He’s allowed just three barrels over this span, but his hard hit rate has increased to 44.9%. Keller has increased his sinker usage by 50% over this run, which explains a small increase in ground ball rate, but not the strikeouts. His velocity is up half a mph from his earlier starts, which may have helped. Keller’s pitch modeling has also improved slightly over this span (3.58 Bot ERA, 100 Pitching+). Keller also has a large split with LHBs 60 points better than RHBs since last year. All non-FIP estimators are above, but within half a run of his 3.66 ERA this year.
DEF: 1
BSR: -2
Back to back quality starts with a single run allowed for Nick Pivetta, his first two since April. A bit fortunate that just six of 17 barrels (12.1%) have left the park, he’s still allowed a home run in five straight. That said, he’s at a 20.2 K-BB% (22.3% last three seasons), driving an estimator range from 3.10 (Bot ERA) to 3.98 (dERA), all well above his 2.72 ERA with a .244 BABIP and 80.6 LOB%. Pivetta does have the top pitch matchup rating on the board today, dominating most Pittsburgh batters with fastball run values.
DEF: 0
BSR: -4
Pivetta is expensive and has some regression coming. I have him just slightly behind that Bassitt/Valdez grouping as well. I think you consider LHBs against Keller with Cronenworth matching up best by run values this year, but I would not go too crazy in a pitcher’s park.
Twins @ Mariners
Zebby Matthews struck out nine of 18 Royals with a 14.8 SwStr% in his second start of the season. He posted an impressive 18.1 K-BB% through 37.2 innings last year, done in by an awful contact profile (14% Barrels/BBE) and six of eight batted balls against the Royals reached a 95 mph EV. Batters from either side are above a .330 wOBA and xwOBA in his nearly 50 inning major league sample with LHBs above .380, but Matthews posted a 21.5 K-BB% and sub-40% hard hit rate at AAA this season, which adds some hope and the park upgrade should help him out here quite a bit too. Matthews is even the rare rookie with projections below four.
DEF: 5
BSR: -1
Bryan Woo gains 34 points of batter wOBA and 7.4 points of K-BB% when he pitches at home vs on the road in his career. This year those numbers are 38 and -0.5 points, but only because he’s improved to a 21 K-BB% on the road. Woo has completed six innings in every start this season, allowing more than two runs only three times. Just five of his 15 barrels have left the park, partially a park effect in Seattle, though his 2.40 ERA is more than half a run below non-FIP estimators ranging from a 3.06 xERA to a 3.52 dERA. Woo’s 2.77 Bot ERA matches his FIP however, as he’s near the top of the board in terms of pitch run value matchups. The Twins have been below average against fastballs and really struggled with sinkers (-0.9 wSI/C), which boosts him here.
DEF: -5
BSR: -5
Matthews is fairly cheap, but workload would be my largest concern here. Woo is the third pitcher in that Bassitt/Valdez group against a Minnesota group that doesn’t strike out much. As you probably guessed, I teased the under last night (7.5) with Minnesota having a marginal offense and the game’s best bullpen. Hopefully this one won’t go to extra-innings tied at two too.
Yankees @ Dodgers
I heard Rob Parker exclaim on MLBNow on Thursday that Max Fried is the AL Cy Young because he has zero losses. I’m not sure about that, but being back to his 2022-23 form with an 18.8 K-BB% and 52.7 GB% sure helps. His contact profile (6.8% Barrels/BBE, 39.5 HardHit%) is actually the worst of his career (more than 100 batted balls). That’s still a 3.36 xERA, which is very much in line with additional non-FIP estimators. Just three of his 13 barrels have left the yard, which seems a bit of a fluke in Yankee Stadium. We’re obviously also looking for his .246 BABIP and 83.3 LOB% (both career bests) to regress as well. LHBs have a .336 wOBA and .313 xwOBA against Fried since last year, but nobody ever plays LHBs against him. You can rest assured the Dodgers will likely have at least three, including two of the best left on left violence perpetrators in the league.
DEF: 7
BSR: 6
Tony Gonsolin started on a nice three start run (twice against Miami), but has allowed eight runs over his last nine innings with one more walk that strikeout (Angels & Mets), including a five barrels and a 55.2 HardHit%. His small sample estimators run a range from 3.98 (SIERA) to 5.05 Bot ERA with LHBs above a .385 wOBA and xwOBA against him since last year with RHBs below .300.
DEF: 10
BSR: 0
Judge is never really off the board, but I’d rather attack Gonsolin with LHBs. Ohtani matches up best with Fried from a pitch run value standpoint. You’re obviously not using pitchers here. Fried’s upside isn’t worth the risk on this board.

LEGEND
Opp wRC+ Opposing offense’s wRC+ Hm/Rd, against L/RHP this season in the first table
DEF Team Runs Prevented in the first table/projected lineup(Roster Resource) Fielding Run Value
Bullpen SIERA/xFIP/FIP average over the last 30 days in the bullpen graphic (because there’s so much bullpen turnover)
BSR: Projected Lineup Base Running Runs
Follow @FreelanceBBall on Twitter and Bsky.app
Add comment
Comments