We’re going to start with a different kind of graph today. One that will begin to inform this piece going forward. It’s perfectly understandable if you want to get right to the baseball stuff and skip ahead.
It’s been a trend so far that traffic picks up Monday through Wednesday before dying out on Thursdays and Fridays. Thursdays are perfectly understandable with the fewest games, but also where I think I do my best work. You may be missing out.
Fridays are perplexing. At least a little. It and Tuesdays are generally the largest daily fantasy slates of the week and always 15 games in total. I’m guessing it’s likely people are just tuning out and doing other work week end activities and that’s fine, but it does mean that I’m not going to continue to put in the time consuming effort with such a decline in readership.
This does not at all mean that Friday articles are going to stop, but they may end up being shorter and different. Maybe a bit more experimentation.
If you’ll look at the graph above again, there is an interesting data point. It was this past Thursday, May 15th. You’ll see a rare uptick on that day with just six games. It was a head scratcher to me until I went back to look at the tweet I sent out on Wednesday night:

Well, the K prop lost and I explained part of the reason why the next day, but it seems people like teasers. They want to know what might be inside. An answer to the question. Okay, readers have talked and I’ve listened. I’ll try harder to tease that day’s content in the tweets if that’s what it takes to gain new readers.
A rather large 12 game slate on Monday, nine of them on the daily fantasy slate. Without even looking at or downloading a single stat, I can already see where I may be most interested in pitching. A pair of lefties out west? Let’s see if that comes to fruition as we still have several TBD as I write this open on Sunday afternoon.
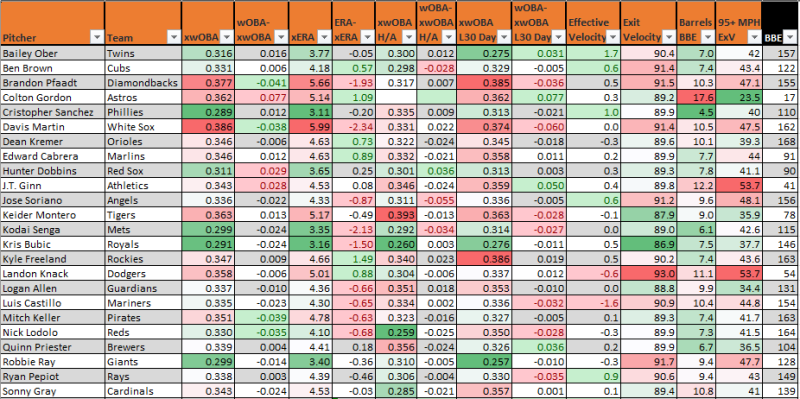
All stats through Saturday. Legend at the bottom of the page.
If you find the information on this site helpful, the tip jar is open at mtrollo86@gmail.com on Paypal.

Reds @ Pirates
Although he throws all four of them from 21.5% to 30.1% of the time, Nick Lodolo has been doing a great job of mixing his pitch usage from game to game that it’s difficult to tell beforehand which one he’ll favor on any given night. With a 3.42 ERA, he runs about a half run below estimators ranging from a 3.85 FIP to a 4.10 xERA, which tell you exactly who he is right now.
DEF: -1
BSR: -2
Mitch Keller elevated fastballs against the Mets in his last outing, striking out a season high eight of 27 batters over seven innings (one run) with not only a season high 13.5 SwStr%, but only his second start in double digits. Allowing four home runs on 12 barrels (Pittsburgh kills RH power), Keller’s 3.61 FIP is his only estimator below four with others ranging as high as a 4.78 dERA and xERA.
DEF: -3
BSR: -4
Both pitchers have high strikeout upside matchups, which don’t help us on the daily fantasy main slate. I’m not sure Keller can turn that trick with his fastball into a regular thing.
Cubs @ Marlins
Ben Brown rarely goes deep in games and hasn’t gone past 22 batters in six starts because his two pitch mix makes it difficult for him to keep hitters off balance after they've seen all he has to offer a couple of times. He does have six inning shutout starts at the Dodgers and Brewers, but that’s really the only way he’s going that deep. A 4.42 Bot ERA is the worst of his estimators and closest to his 4.75 ERA. He’ll miss bats, but he’ll also walk a few guys and allow a lot of hard contact.
DEF: 7
BSR: 1
Edward Cabrera hasn’t gone six innings in any starts and we all know a 9.9 BB% is the reason why. He’s walked just two of his last 41 batters, but also with just six strikeouts and the second of those starts against the White Sox, where he still couldn’t get through six innings. A 5.12 dERA is his closest estimator to a 5.52 ERA.
DEF: -2
BSR: 4
Both of these pitchers have positive regression coming, but also need to make adjustments to really improve and break out.

Mets @ Red Sox
Despite not allowing more than two earned runs in any start this season, Kodai Senga both looked and admitting to feeling his best, striking out a season high seven of 25 Pirates last time out. He threw his fastball a season low 27.5% of the time and his famous ghost fork a season high 40.2% to generate a 13.6 SwStr%. Pitching+ gave the pitch a 126 grade, well above his season 114 rate in the outing (PitchingBot doesn’t grade forkballs). The cutter was the only other positively graded pitch in the outing. The single home run and seven barrels (6.1%) are major reasons for the FIP (2.86) and xERA (3.35) being his only estimators below four. This, despite a hard hit rate (42.6%) higher than his ground ball rate (41.2%). It’s difficult to take his Bot ERA (5.07) seriously when it doesn’t factor in the forkball.
DEF: -7
BSR: 2
Hunter Dobbins is coming off his second poor start in his last three, but the Twins and Tigers are the only two opponents he’s allowed more than two runs against and both of those teams have been smoking. The real draw has been a 3.4 BB%, driving a 16 K-BB%, giving him estimators all within half a run of his 3.90 ERA. A 4.09 Bot ERA is the worst of those, not really loving the slider (45 grade).
DEF: 5
BSR: 1
I have these teams very evenly matched and am a bit surprised to see the Mets favored in Boston. While Dobbins currently has the slightly better estimators, I don’t expect that to last, but home field nearly evens that up. We do want to watch some potentially nasty weather, but I have to side with the home dog for +120. Follow Rocky Jade on Action Network for more.
Astros @ Rays
Written before Colton Gordon’s debut last Wednesday:
Gordon has posted a 25.3 K% and 4.7 BB% at AAA this season, but has been pitching there since 2023 (16.3 K-BB% last year and 4.9% in smaller sample the year before) and at 26 years-old projects just a 35+ Future Value grading without a standout pitch. The best thing about him may be the command. There has been no Fangraphs ink spilled on him this year.
He walked two of 22 batters, but the 2.4 SwStr% in his debut certainly didn’t impress anybody. He did only allow four hard hit batted balls (23.5%), but three of them were barrels with a 52.9% fly ball rate. Considering it’s actually right-handed power this park has boosted, rather than left-handed (which has a negative park factor), there should be some concern for this start. RHBs boasted a .477 wOBA and .377 xwOBA against Gordon in his first start. While PitchingBot liked his arsenal, Pitching+ didn’t even bother grading the fastballs. He projects slightly below four and a half.
DEF: 3
BSR: 1
Striking out seven of 25 Blue Jays with the worst version of a quality start is an acceptable outcome for Ryan Pepiot, who had struck out just seven over his previous three starts combined. He sat a season high 95.3 mph against Toronto, a velocity he’s only matched in his first start of the season and one other. Nine of his 14 barrels have left the park and maybe that’s the park influence with only three of his starts on the road. While Pepiot has the best pitch modeling on the board (his stuff is just that good), he has no other estimators below four with all within half a run range of his 3.93 ERA. His lack of a split (batters from either side between a .300 and .310 wOBA and xwOBA since last year), doesn’t really help him in this spot.
DEF: -7
BSR: -3
This park hasn’t really been what most people thought in March. It’s barely been a positive run environment (102) and while it has boosted right-handed home runs, it has a negative home run factor for LHBs. Does that give Houston bats an advantage here? I’m sure the Rays will jam in RHBs against a lefty too. I really think we’re looking for RHBs here ahead of anything else.
Guardians @ Twins
Six shutout innings on three hits and a season high six strikeouts for Logan Allen against the Brewers last time out. He did not allow a barrel with only four hard hit batted balls, dropping his season hard hit rate down to 34.1%, despite the 9.8% Barrels/BBE he’s allowed. Combine that with a 6.0 K-BB% and you can see where there might be problems. Dropping his 90 mph fastball down to a season low 19.1% against Milwaukee with more cutters (19.1%) and sliders (38.2%) than he’s thrown in any other start probably didn’t hurt. The cutter is Allen’s only pitch with a positive pitch modeling grade, while the slider grades worse than the fastball. If the command is sustainable, maybe he has a chance, but for now, all non-FIP estimators exceed his 3.70 ERA by at least two-thirds of a run, while RHBs have a .377 wOBA and .375 xwOBA against him since last year.
DEF: 4
BSR: -3
Bailey Ober averaged 91 mph exactly for only the second time this season in his last outing. With the pitch averaging 91.7 mph for all of last season, I’m surprised the pitch’s grade hasn’t declined, though the rest of his arsenal has (3.62 Bot ERA to 4.22, though Pitching+ only from 104 to 103). Ober hasn’t allowed more than three runs since his obligatory awful first start of the season, but his 13.3 K-BB% is more than six points below last year, while his 41.4 HardHit% is up over seven points. While his 3.72 ERA matches his 3.77 xERA, additional estimators are higher. Ober’s reverse split (LHBs .266 wOBA, .264 xwOBA since last year), should help him here and did in his first start against the Guardians, a season high 7.2 innings, but with a season low two strikeouts.
DEF: -1
BSR: -1
Another of the cooler spots on the board on Monday and while I generally like this matchup for Ober, he hasn’t shown nearly the same upside and costs quite a bit. He’s more reasonable for $8.2K on DraftKings. The same may be able to be said about Allen for $6.5K with Minnesota now missing a key bat or two, but he hasn’t shown me enough to pay a FanDuel price nearly $2K higher.
Mariners @ White Sox
Nearly one-third of the way through the season, how long do we have to wait for the baseball gods to give us that truly juicy Luis Castillo road matchup against a potent left-handed lineup. It wasn’t against his first three road opponents (Reds, Blue Jays or Rangers) and it won’t be again tonight. The result has been that he’s only allowed more than two runs three times, despite further drop in velocity (97.1 – 96.3 – 95.6 – 94.7 mph each of last four years) and K-BB (19.8% - 20.3% - 17.8% - 8.9%). While Castillo grades well from a pitch matchup standpoint against the White Sox because who doesn’t, he doesn’t have a single non-FIP estimator within half a run of his 3.65 ERA with just 25% of his barrels leaving the yard. LHBs are within five points of a .350 wOBA and xwOBA against him since last year.
DEF: 1
BSR: 0
Davis Martin posted his fourth quality start in eight tries last time out in Cincinnati, recording his first two seventh inning outs of the season. And there’s not a cheap QS among them with a total of four runs (two earned) in the four. With just a 10 K-BB% and 10.5% Barrels/BBE (47.5 HardHit%), like Castillo, Martin’s 3.65 ERA is only met by one estimator (3.89 Bot ERA) within half a run. While he doesn’t match up well for the Mariners pitch for pitch, every pitch in Martin’s arsenal receives a grade of 47 or better, a bit more optimistic than his 99 Pitching+. PitchersList did mention an attraction to a cutter he threw a season high 47.4% of the time last time out.
DEF: -10
BSR: 0
I would recommend bats here, but this is another pitching weather game. In that case, I guess Castillo might be okay for $8.5K on FanDuel. However, this Seattle offense is legit and only has a 20.5 K% away from home, making Martin a tougher roster.
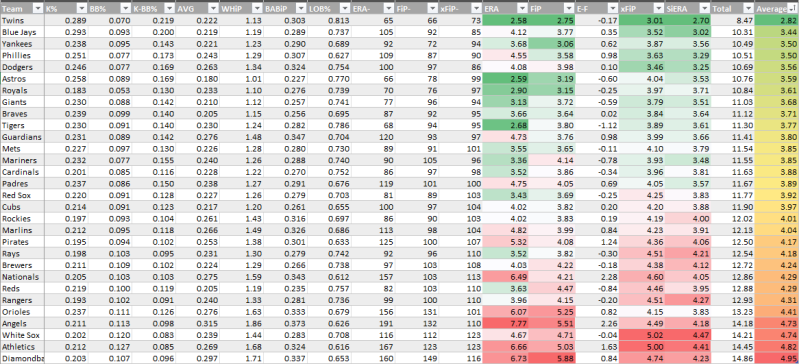
Last 30 day bullpen stats below.
Orioles @ Brewers
Dean Kremer struck out eight of 25 Twins two starts back. They got him for four runs his last time out, but the point is that those eight strikeouts are more than twice any other start since his first of the season. Kremer is now bringing you barrels (10.1%) with just a 9.7 K-BB%. A 4.03 Bot ERA is more than half a run below any of his other estimators with LHBs owning a .333 wOBA and .340 xwOBA against him since last year.
DEF: -3
BSR: 5
Quinn Priester hasn’t struck out more than four in a start with only two more strikeouts (23) than walks (21) this year. Even with a 54.9 GB% and solid contact profile, a 4.11 dERA is his best estimator by nearly one-third of a run. He has the worst pitch modeling on the board, but not a terrible matchup against the Orioles from a run value standpoint. LHBs have a .393 wOBA and .385 xwOBA that’s more than 100 points better than RHBs since last year.
DEF: 2
BSR: -3
Milwaukee is a negative run environment (92 park run factor) with the roof closed, as it should be with cooler temperatures again. Kremer is almost cheap enough where you can see it working, but my affinity is clearly for LHBs in this game.
Tigers @ Cardinals
Not yet confirmed, this appears to be an opener for Keider Montero, who has a 4.68 ERA that’s lower than any of his estimators, save a 4.38 Bot ERA, through 25 innings. Batters from either side of the plate are between a .343 and .353 wOBA and xwOBA against him since last year.
DEF: 7
BSR: 2
Have we reached that part of the season where Sonny Gray begins getting pummeled by LHBs again? While LHBs have a .324 wOBA and .318 xwOBA against him since last year, it’s actually RHBs with a .335 wOBA and six of his nine home runs allowed this year. Three of those nine came in Philadelphia last time out, bringing him to barrels on 10.8% of contact on the year and a 4.53 xERA matching his 4.50 ERA. With a 19 K-BB%, he still has contact neutral estimators around a run lower, but even that is a 5.4 point drop from last year with declining pitch modeling (3.16 Bot ERA, 107 Pitching+ to 3.92 Bot ERA, 98 Pitching+).
DEF: 12
BSR: 3
St Louis appears to be one of the less ominous weather spots on Monday, generally playing like a neutral park, but still tough on power until it really heats up in the summer. A strong Detroit offense takes a $9K Gray off my radar for the most part and I would add some Detroit exposure in multi-entry. Keider is only for punting on DK if absolutely necessary. We don’t even know if he’s pitching and he only went 3.1 innings after his last opener.
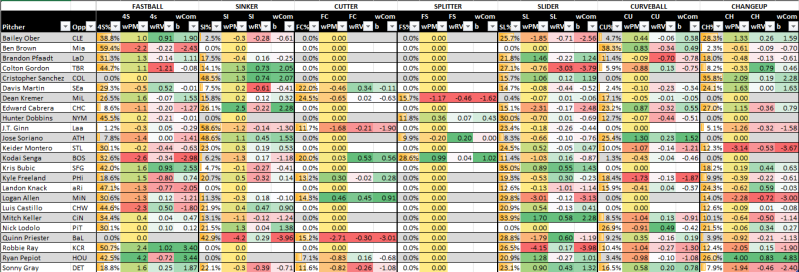
Below, these last two graphics are my new pitch matchup ratings, explained here. It uses pitch frequencies and run values both for the pitcher and the opposing offense and then attempts to add in pitch modeling, which sometimes differs from actual results.
Phillies @ Rockies
Four of Cristopher Sanchez’s last six starts have been quality starts, the two exceptions sandwiching his skipped start with a forearm issue. His 19.1 K-BB% is up 4.6 points from last year, while sustaining the ground balls (56.4%), generating just 4.5% Barrels/BBE on a 40% hard hit rate that’s a bit higher, but still not far off average for this season (it seems to rise every year). His 2.91 ERA is below, but within one-third of a run of all estimators except for a 3.59 Bot ERA that’s still one of the board's best numbers, giving him one of the best pitch matchup ratings on the board today, and a 3.66 FIP with all five barrels turning into home runs.
DEF: -6
BSR: 0
Kyle Freeland threw six shutout innings in Tampa Bay in his first start and still has a 6.11 ERA with six of his 37 runs unearned. The problems are a ridiculous .377 BABIP and 50 LOB%. Freeland’s 4.66 xERA (43.6 HardHit%) and 4.05 Bot ERA are his only estimators above four with a 13 K-BB% and half his contact on the ground exactly. He does reside near the bottom of the pitch matchup ratings, while batters from either side of the plate are between a .343 and .358 wOBA and xwOBA against him since last year.
DEF: -5
BSR: -3
This is our main event for the evening. Pitcher friendly weather at Coors (temps in the 50s) enhances Sanchez, who I have ranked as the third best pitcher on the board and very close to second best. He is also cheaper than the top two, giving him some nice value. Again, aside from a clear punt, the weather isn’t enough to take us off of Philadelphia bats here, though Freeland does have some positive regression coming his way.
Which brings me to my next point. The Rockies have won just eight of 46 games which is pretty hard to do if you have major league caliber (even the worst) talent and are still trying. Lines are beginning to spike because everyone wants to bet against them. That’s going to make for some ugly value spots and this is one of them with Freeland’s ERA/estimator gap, but I don’t really expect this line to drop, so I’ll wait.
Royals @ Giants
Kris Bubic struck out a season high nine Astros in his sixth quality start of the season. His reverse split (LHBs .249 wOBA, .252 xwOBA since last year) certainly helped there and now he gets a large park upgrade. Bubic’s 18.7 K-BB% is 23rd among qualified pitchers with a 37.7 HardHit% generating a 3.16 xERA. While his 1.66 ERA is a fluke (86.5 LOB%, three home runs on 11 barrels), a 3.63 Bot ERA is his only estimator reaching three and a half, though he still sits atop of the pitch matchup ratings and only drops to third when including pitch modeling.
DEF: -3
BSR: 4
Robbie Ray has at least eight strikeouts in four of his last six starts (17.7 K-BB%) and while walks (12.4%) might still be a problem, hard contact (46.9% with 9.4% Barrels/BBE) is less of a problem in his home park and even less than that against the Royals (2.8 HR/FB vs LHP). Like Bubic, his 3.04 ERA is a fluke (82.1 LOB%, five home runs on 12 barrels), but only one estimator runs above 4.12. That is a 4.74 Bot ERA with both systems HATING his slider (31 PB, 75 P+), but Ray is just below Bubic on the pitch matchup ratings board when only considering run values.
DEF: 3
BSR: -1
With a pair of offenses that have stunk against LHBs, here are my top two pitchers today. Ray barely ahead of Sanchez and at a higher price probably has the least value of the three against a contact prone, but powerless Kansas City lineup. The highest K% against LHP in the projected lineup (Roster Resource) since last season is Pasquantino’s 22%. The Giants, on the other hand, project a lineup of at least five above 24%. Bubic is the most expensive pitcher on the board, but still my best FanDuel value and about in line with Sanchez in terms of value at $1700 more on DK.

Angels @ Athletics
Lots of ground balls (62.1%) with a reverse split (RHBs within three points of a .330 wOBA and xwOBA since last season) are what you are going to get out of Jose Soriano. Occasionally he’ll pop a few strikeouts, but only twice more than five this season and once more than six with too many walks, resulting in an 8.4 K-BB%. The ground balls keep most of his estimators below four with the exceptions of a 4.33 xERA, as he’s still generating 9.6% Barrels/BBE, despite the ground ball rate because 48.1% of his batted balls have reached a 95 mph exit velocity. His 4.57 Bot ERA is in stark contrast to a 108 Pitching+ with the major discrepancy in the sinker (46 PB, 116 P+). Pitch run values are more in line with the latter.
DEF: -8
BSR: 1
J.T. Ginn made three starts before hitting the IL with an elbow issue, striking out five of 14 batters in a lone rehab start. His sinker is a point of contention, going from 94.8 mph in his first start of the season, a revenge spot against the Mets, who traded him, but dropping to 93.5 mph and 93.1 mph in subsequent starts. This is the cause of conflict in his pitch modeling as well (5.24 Bot ERA, 104 Pitching+) as PitchingBot hates a sinker (40) that Pitching+ loves (112). LHBs have a .392 wOBA and .366 xwOBA against Ginn in his short career (106 LHBs faced).
DEF: -12
BSR: 0
A pair of sinker heavy pitchers with the same pitch modeling issues, but different platoon splits (Soriano throws curveballs second most frequently). That’s fine. It doesn’t matter in this park. It’s all bats. A 123 Park Run Factor ties with Coors for highest in the league and here temps may start near 90 degrees before dropping. In fact, not only is this a great spot for bats daily fantasy wise, but I’m on the over (9.5 -110). Defenses and bullpens have been awful too. One last thing to note (that favors A's bats) is that the home run factor for RHBs is 50 points higher than LHBs so far (137/87).
Diamondbacks @ Dodgers
Brandon Pfaadt faced the Dodgers two starts back and threw 6.1 shutout innings, striking out six with three walks. Sandwiched around that, he’s allowed 11 runs (10 earned) in 8.2 innings. He’s working on pitches to better navigate LHBs (within four points of a .350 wOBA and xwOBA since last year), but it’s not really helping yet (.341 wOBA, six home runs this year). The larger problem is that RHBs are now up to a .325 wOBA against him too. While Pfaadt’s ERA has dropped a full run, all of his estimators are up (3.78 xERA to 5.66). The difference has literally been his strand rate going from 64.5% to 79.9%. The K-BB (14.4%) is down four points, while barrels (10.3%) and hard hit rate (47.1%) are up substantially, while his pitch modeling has declined to average. The advent of the curve and the change seem to be coming at the expense of the quality of the fastball and sweeper.
DEF: 3
BSR: 3
Landon Knack struck out a season high eight A’s with just one walk, increasing his K-BB to a respectable 14.6% through 18.1 innings, still 3.2 points below last year. However, he allowed five runs, including two runs on three barrels and is rocking the double digit barrel rate (11.1%) with a 53.7 HardHit%. The pitch modeling (as seen in the last graphic) is similarly below average to last year, despite the quality peripherals. Batters from either side of the plate are between a .300 and .331 wOBA and xwOBA against Knack since last year.
DEF: 6
BSR: 4
You’re rarely rostering pitchers against either of these lineups and today’s not the day. Bats here. I liked Pfaadt better when he wasn’t even trying to get LHBs out. Let’s hope he gets it back together. I also like the over here (9.5 -105) and wouldn’t hate just the Dodger portion of it (over 4.5) either. Arizona also has the worst bullpen estimators in the league L30 days with all of those injuries.
LEGEND
Opp wRC+ Opposing offense’s wRC+ against L/RHP this season (in first graphic)
DEF Projected lineup(Roster Resource) Fielding Run Value (Team Runs Prevented in first graphic
B30 Bullpen SIERA/xFIP/FIP average over the last 30 days (because there’s so much bullpen turnover)
BSR: Projected Lineup Base Running Runs
Don’t hesitate to ask about anything else that’s unclear.
Add comment
Comments
Your work is so detailed and appreciated! Thx for putting in the work and sharing!
Thank you. Appreciated.