It was not my intent to completely abandon posting here, but life has been keeping my plate fill. Yet, I'm still paying for the services, so it seems like the right place and time and recap my first half season at Action Network and hold myself accountable.
Keep in mind that I haven't yet looked at the specific numbers as I write this opening. I have an idea, and it's not good (especially the last month or so), but you'll be getting my thoughts as I see the exact results for the first time.
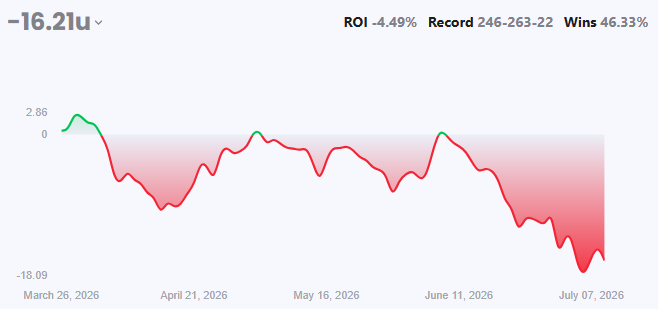
Yup, that's about what I expected. The last month has been rough, as mentioned already, but we're going to break this all down further.
You can see a set (three) of rough patches here, the first two less punishing than the most recent one and each time I was able to pull the nose up to break even before derailing again.
After a nice start, which had us up 2.86 units on March 30th, we see the first valley, a 13.27 unit down streak lasting for about two weeks or so.
To be honest, I don't know anyone who had a great opening month. If you'll recall, there were a lot of strange happenings and chaos. Pre-season projections were quickly turned on their head for several early favorites and expected bottom dwellers like the Cardinals.
Sometimes that volatility is good for sharp players who will generally be playing more dogs and unders than the public, but it was still crazy. I gained a total of 46.21% in CLV (Closing Line Value) during this down stretch.
This was followed by a 10.87 unit uptick that lasted from April 15th to May 5th.
The next downtick lasted until May 29th, covering most of the month of May with a deficit of 8.73 units, which including 59.16% in CLV.
An 8.84 unit upswing to start June was the last good week charted.
From June 7th to the season low point of July 6th, the slide was 18.66 units. The CLV over that period was a whopping 336.52%.
So...a few things here.
There are almost certainly going to be bad calls a grueling baseball season and most times several every week or even day. I'm certainly not immune to that.
There's also going to be a lot of volatilivity because the ball is bouncing off a bat. There have been a lot of their team scores in the 5th inning and/or my team scores in the 6th instances during F5 plays. There have been a lot of late game blowups by supposedly strong bullpens. Weak bullpens occasionally shutting down good offenses.
There was one particular stretch a few weeks back where I had several team totals or general overs with first inning outbreaks up to six runs and then complete zeroes the rest of the way.
I mention none of this to say "Look at me. I run bad. Sad face", but rather to continue to evaluate and confirm the work is at least correct.
I'll look at pitcher breakdowns (SwStr% and to a lesser extent CStr%) for pitching K props. I'll use twitter accounts like @mlb_simulator to break down luck components.
For example, one of or maybe my worst single day was a 3-6 Saturday a couple of weeks back on July 4th. Let's break it down with those methods.
It started with a Pirates team total that went over by several runs, though @mlb_similutor suggests is was one of two or three games I should have actually lost.
The next was a Rays F5 that started the day 2-0, but I also had a Rasmussen strikeout prop that fell short by 4 strikeouts. However, a 13.5 SwStr% in that game suggested he normally has 5-6 strikeouts.
We followed up with a game in Atlanta that ended up going way over the total, but a bases loaded two out popup drop scored three and led to not only a lengthened inning and increased pitch count for the starting pitching, but then lower leverage relievers who got blowup up and even a position player on the mound.
Then there was a total in Colorado that was 96% to go over after the top of the 2nd, but was shut down by San Francisco and Colorado bullpens (two of the worst) at Coors the rest of the way. Not only that, Sugano, the pitcher I had based most of analysis on, was scratched and replaced with a RHP.
Next was a fairly sweat free win on a Miami team total in Sacramento.
The evening was capped off by a double loss in Arizona on a Milwaukee F5 and their team total. Brandon Woodruff started that game despite being injured. He allowed a three run homer in the first, his velocity cratered and he was removed early and placed on the Il.
The Brewers scored just three runs and failed their team total by two, but here is the @mlb_simulator tweet for that game.
https://x.com/mlb_simulator/status/2073625515458503098?s=20
Pay particular attention to not only the Brewers winning 94% of the time, but their run distribution, where they score fewer than five runs in this game less than 10% of the time.
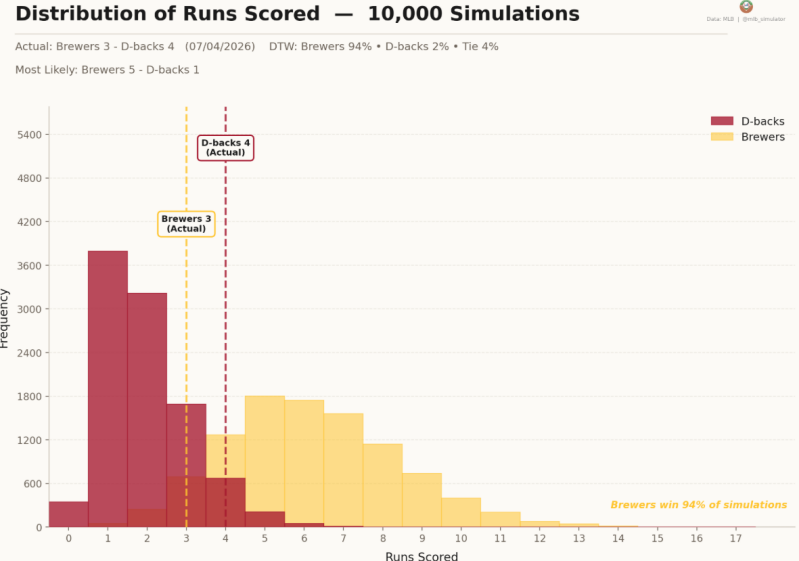
Theses are incredibly useful tools to use to confirm whether or not your process has faltered that wouldn't be available a decade or more ago.
Speaking of process...
While I've been vocal about AI deceiving me in the past when I need it to look up something for me, it can be pretty useful for formulas and difficult math. It has helped me refine my process, tightening up my game projections and greatly helpful to help incorporate environmental effects (park/weather/ump) more neatly into strikeout projections.
The effects have been positive on the strikeout end, perhaps the only thing going well over the last month. Although, you can still see, the best CLV performers not meeting with upward results. It's actually been much better since that Rasmussen loss (7-1 overall and 2-0 on 5%+ CLV).
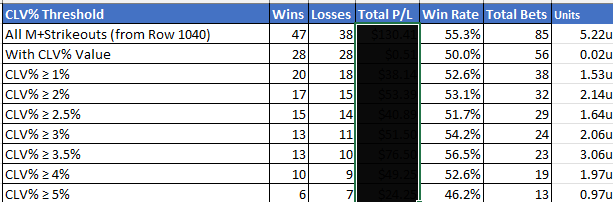
I may as well include CLV for the entire season, as you can see a barely break even effect at everything above 1% and also above 5%, two areas that should improve going forward. Between 3-5% seems to be the sweet spot, but you would intuit that it would increase the higher the percentage, but that's a much longer term result.
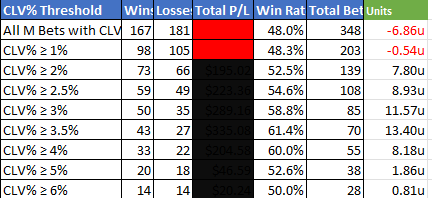
Breaking down the profit/loss into categories, it seems the biggest problem has been totals and I wonder how much that has to do with the juicy ball discovered in June, near the start of the overall downward spiral, though it would have nothing to do sides. That's why I like to check @mlb_simulator or similar tools. Perhaps I'm being a bit too aggressive with dogs.
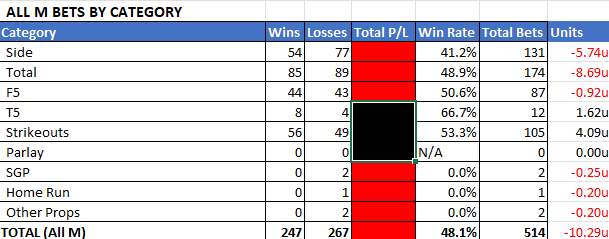
Then again, its still a small sample that's been profitable in the past. F5s, whether side or total (T5) have been either break even and/or too small a sample to work with.
Finally, a breakdown and separation of early plays or ones posted the night prior to games, which would include all of those posted in Action Network articles, which I didn't separate into its own sub-sub-group.
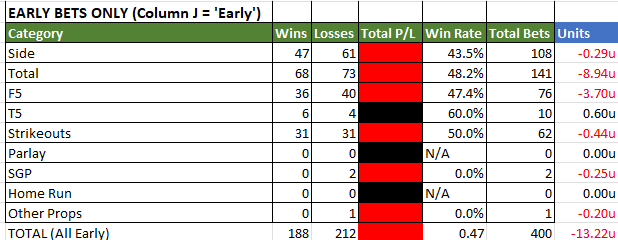
Unfortunately, the overall results appear to be worse, though closer to break even in sides. Virtually no change in totals and slightly worse for F5 sides.
One word about strikeouts. Earlier in the season, I was experimenting with different things and even noted so in tracking notes, so I'm not as concerned with the overall results as with the first set or results posted above, which you can even see starts at line 1040 on my excel sheet.
A final words on this before moving on to the conclusion. I've famously mis-tracked several plays in the Action app, which is why results may not match up. While a lot of the mis-tracked results have coincidentally ended up in losses, I'm confident that tracking notes (which I can edit, but not actual plays) and articles have driven players towards the correct play, even it was posted wrong.
Finally, I want to compare to previous seasons to illustrate a point of less concerns.
I believe even the best baseball players in the world, aside from those heavily involved in arbitrage, but those projecting sides and totals and strikeouts and home runs and whatnot, are going to run into long losing stretches and very likely even losing seasons because baseball is the most volatile of the major sports.
I've certain had losing seasons in the past. Let's start in 2022, when I first started tracking full time on Action Network and was accidentally tracking 100 unit plays instead of single units.
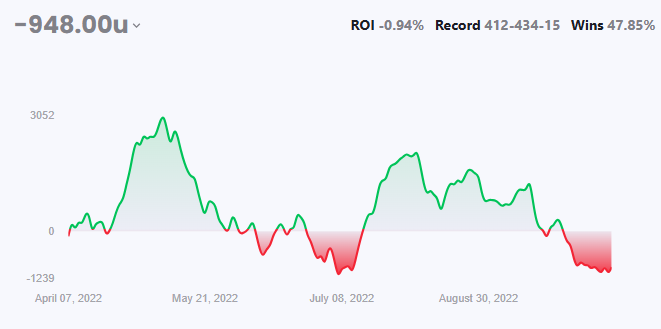
As you can see, I was in profit for most the season, but experienced a pair of major downswings of 40 units heading towards the break and then, after a near 35 unit bounce back, another long, three month, 30 unit downswing to end the season. Because of those 100 unit plays, I'll be digging out of that forever.
This was followed by a terrible season from start to finish in 2023, though there was some good news towards the end with some adjustments.
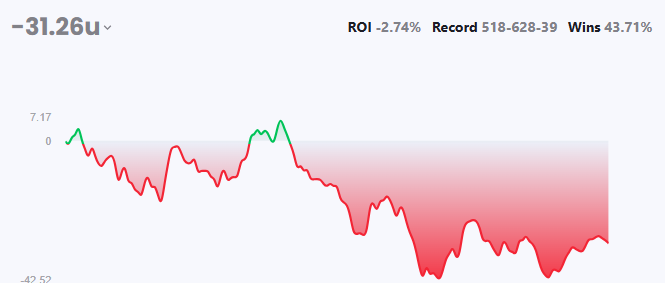
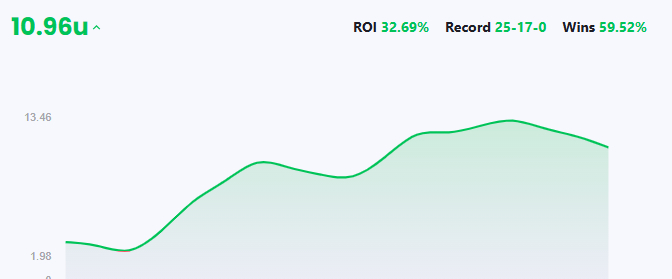
The 2023 post-season, including an 18-2 run, was the start of two profitable years following...
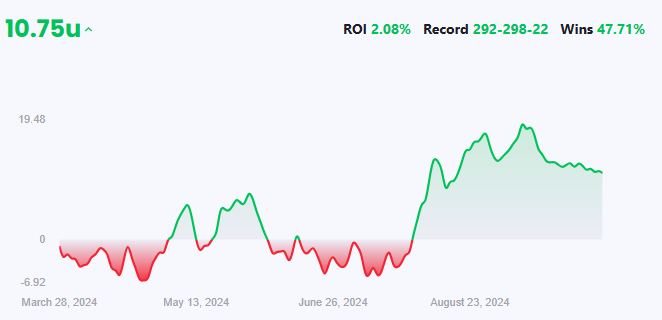
You can see how much of a grind the 2024 season was until the end of July before finally pulling up the nose for good with a 25 unit upswing following a 15 unit downswing that's similar to 2026.
Finally, a 2025 season that was also a grind until the end of July, but we still see around a 20 unit profit from the 2023 post-season on and similar periods of loss to 2026 before righting the ship.
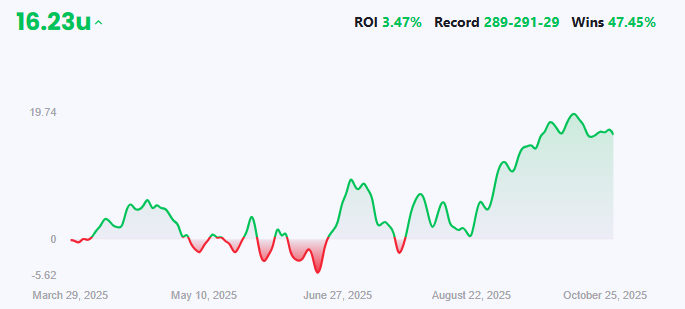
The point I want to make with all these graphs is that I'm more confident in my process than ever and feel this too shall pass as it has in the past.
In fact, considering this graph, maybe my process just lends itself to needed a larger base of in season results. Or maybe I'm just the Julio Rodriguez of baseball writing. Moderate first halves leading to second half explosions. Let's hope the pattern continues in 2026.
Add comment
Comments