This is it! We’re down to the final four to seven games of the season and if the market is right, it’ll be closer to the former than latter. The Dodgers are heavy favorites in this series and for good reason, most of which we’ll cover below.
Initially, I had planned on only doing a series write up and calling it quits for the season, but instead, I’m going to open with the series preview and then add additional games (though maybe not all) to this post as we go throughout the series.
I’m also listing all eight (or maybe nine) potential/likely starters right off the bat. The Dodgers have been pretty clear about their top four, while there might be some wiggle room for Bassitt to get a start if things don’t go as planned for Toronto.
Note that any L30 or L7 day stats below are from the full post-season
All stats through the regular season unless otherwise noted. Legend at the bottom of the page.
If you find the information on this site helpful, the tip jar is open at mtrollo86@gmail.com on Paypal.

Dodgers vs Blue Jays World Series Preview
This series will matchup the two top offenses in the post-season. Toronto led all 12 teams with a 143 wRC+, while the Dodgers were second with a 113 wRC+. Only the Seattle Mariners (101) were also above 93 with eight of the 12 teams below a 90 wRC+ over the last few weeks.
Additionally, the Blue Jays are expected to get Bo Bichette back, putting their weakest hitter (IFK) back on the bench.
Game One (and potentially Game Five) will be the only time where either offense will be facing a LH starter (Blake Snell), which doesn’t necessarily hurt the Jays, who had a 111 RC+ vs LHP this year, fourth in the league, just a fraction of a point behind…the Dodgers (also 111). Against RHP, we also have the fourth and fifth best offenses by wRC+, also separated by less than a point (LAD 114 vs TOR 113).
When we look at our projected lineups, if the Dodgers send out the same lineup they did in the LCS against RHP, it averaged a 123 wRC+ and .204 ISO vs RHP this season and a 121 wRC+ in the post-season. The projected Toronto lineup vs RHP (Bichette in for IKF) averaged a 118 wRC+ and -183 ISO vs RHP with a 155 wRC+ this post-season (omitting Bichette). Against Snell, I project Schneider and Straw in for Lukes and Barger, giving the lineup a 115 wRC+, but just .163 ISO against southpaws this year on average with a 141 wRC+ this pot season.
It's very close with only Toronto’s post-season performance stopping me from giving a clear edge to the Dodgers.
--
The one clear and massive edge for the Blue Jays will be the defense. Here and with base running, where the Dodgers have the edge, Bichette actually hurts the Jays significantly, but they are still one of the best, if not the best, defenses in the league. The Dodgers aren’t bad either, but closer to neutral. By Fielding Run Value (Statcast), Bichette will be the worst defender to regularly take the field this World Series (unless he DHs). A run worse than Teoscar Hernandez and two worse than Will Smith, who’s a strong framer, but poor in other components, especially throwing.
--
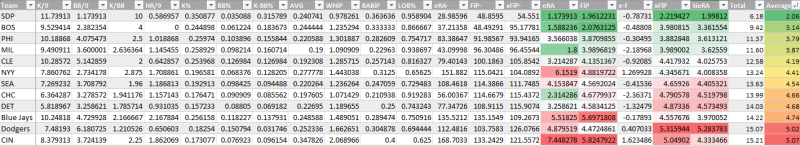
Somehow, in the era of post-season bullpening, when starters average far fewer than five innings per start, the 10th and 11th bullpen (by SIERA/xFIP/FIP average) of 12 have made it to the world series. And that’s just post-season numbers. The Dodgers have a 4.47 FIP this post-season, due to some nifty HR prevention, but a SIERA and xFIP above five. The Blue Jays average more than a quarter run less with a 3.97 SIERA, but 5.70 FIP. The Blue Jays bullpen 2.17 HR/9 in the post-season is nearly four times Dodgers 0.65. In terms of K-BB%, Toronto is at least average (13.8%), while the Dodgers are 10 points lower.
However! There are two very significant developments benefiting the Dodgers. The starting rotation is as healthy as it’s been all season and pitching dominantly deep into post-season games. The playbook has often been the starter for seven innings, patchwork the eighth with your best available arm or two and then Sasaki to close. He’s the other development. He’s struck out six of 29 with two walks, which is only about league average, but with just three barrels and a 38 HardHit%. You might say that he has some regression coming, which we may not be here long enough to see, but most of his problems came in one appearance against the Brewers. He faced five batters with two walks and two hard hit batted balls, two of his three barrels.
--
Now we’re down to starting pitching, where the Dodgers have their largest advantage. While we have some idea in which order they’re going to go with Snell and Yamamoto in Games One and Two, we aren’t so sure how the Blue Jays will set up. Ideally, it would be the same as the ALCS with Gausman and Yesavage going at home, but the former threw 19 pitches in relief on Monday (G7) after 91 three days before (G5). It shouldn’t be enough to change their plans, but they haven’t confirmed anything yet.
Regardless, the Dodgers will have the starting pitching edge in every matchup of this series. The only question will be how large.
Overall, in 10 game starts, Dodger pitchers have thrown 64.1 innings, while Blue Jay pitches have thrown 13 fewer innings in one more game start. The Blue Jays starters have a 3.33 ERA with an xERA, FIP and xFIP all just eclipsing four (4.03 avg), while the Dodgers starters have a 1.40 ERA with an xERA, FIP and xFIP all below two and a half (2.16 avg). Dodger starters have a 25.6 K-BB% this season, or basically Garrett Crochet (25.7%) on average, while the Blue Jays starters have a 17.1 K-BB%, still pretty strong, but more Aaron Nola, Tyler Glasnow (both in down years), Max Fried, Chad Patrick and J.T. Ginn. First, I bet you didn’t realize some of those starters had such strong numbers. Second, still a very wide gap.
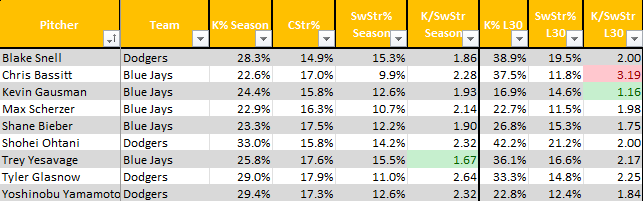
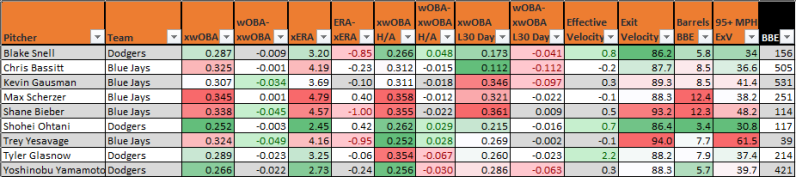
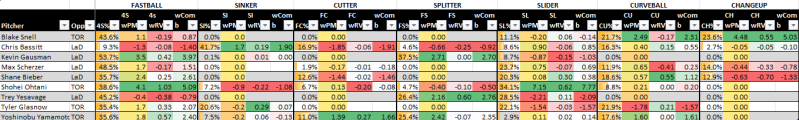
If you’re looking for more regular season stats, the gap is even wider and it starts directly above. The first place you see pitcher stats, L2 year SIERA. The four worst marks all belong to Toronto starters. The first Los Angeles starter is half a run better. The only Toronto starter among the Los Angeles starters had Tommy John Surgery during that span. Dodger starters have the top four strikeout rates of the nine this season. Dodger starters all have an xwOBA against below .300 this season. Toronto starters all above .300.
Pitch modeling: well, Glasnow wasn’t good, but Gausman’s Bot ERA is the only other mark that slips in between Dodger starters. Same chart, top three pitch run value matchups, all Dodgers with nearly half a run of separation, though Toronto bats had some really strong run value stats against what Snell throws. Yet, it still favors him slightly.
Where does this all put us? It means I’m going to have the Dodgers at least slightly favored in every game and more significantly favored at home. I already have enough futures in play that there’s no reason to bother with the series line for me, but I don’t see any real value in it anyway.
DraftKings currently has a 30% profit boost on player props. While I’m more comfortable with pitching, the only available props are pitcher strikeouts and only overs. In addition, it has to be lower than -200, which takes all potential two game pitchers off the board except for Gausman and the starting number is 10 strikeouts. I’m sure you know how infrequently the Blue Jays strike out, so we move along to the hitter categories (home runs, hits, RBI and SB). FanDuel has no promos yet.
I can think of a lot of reasons not to play overs. They pitch around Ohtani all series. It may only go four games. It’s tough enough projecting baseball performance, but predicting opportunity as well? If Yesavage pitches Game One, I could see playing his strikeout total with the DraftKings bonus. They don't even have a series strikeout leader prop.
UPDATE: Yesavage is pitching Game One, but his 10+ K prop has moved to -300 and is ineligible for the bump.
Dodgers @ Blue Jays (G1)
As we’ve already mentioned in the series preview above, the Dodgers have confidently pushing their starting pitchers further in the post-season than in the regular season with Blake Snell facing 72 batters over three starts, those 24 batters per start a full batter higher than his average during 11 regular season starts.
Backing up a little bit, after walking four and striking out two in each of his first two starts for the Dodgers this year, Snell hit the IL. In nine regular season starts after returning, he posted a 24 K-BB%, hitting 40% three times and 33% as well. His pitch modeling is best on Monday’s board, while a 3.64 SIERA is his only estimator reaching three and a half. Snell also managed to keep nearly half his contact on the ground (48.7%) with just a 34 HardHit%.
His Wild Card start against the Reds couldn’t have gone much better. The fastball up nearly a mph, maintaining it’s 18 inch iVB, Snell generated 19 whiffs on 91 pitches, including 15 of the 20 swings against his changeup (31 Z-Contact%). He struck out nine of 26 batters with just a single walk and 10 of 16 batted balls on the ground.
He followed that up with six shutout innings against the Phillies in Game Two of the Divisional Series. He did walk four, but struck out nine and allowed just a single hit. Snell’s velocity was up even further (1.4 mph) from his season average with an added inch of iVB (19), helping him to generate whiffs on 23 of the 42 swings against him, nine each with the slider and changeup, which he only threw 26 and 23 times respectively.
With the Dodgers not having to go past four games in any of the three series they’ve played, Snell also started Game One and only that game in the NLCS. It was, in part, his dominance of the Brewers that gave the Dodgers the chance to shorten the series to the bare minimum.
Snell was up a full mph over his season average, down 0.4 mph from his NLDS start, but only threw 28 fastballs, despite the extra inch of iVB, giving the pitch an elite 19 mph ride. He generated four whiffs and another 10 called strikes on the heater, but led the way with 38 changeups that generated 14 whiffs. Snell collected 22 swings and misses over eight one-hit innings, striking out 10 in 103 pitches to bring him to an overall dominant 31.9 K-BB% this post-season, which is actually just third best among those with at least 10 innings pitched, behind a guy expected to pitch once the Dodgers return home in this series.
Snell did have a bit of a split this year, but held batters from either side of the plate below a .300 wOBA and xwOBA. Still, RHBs did hit Snell a bit better (.282 wOBA, .295 xwOBA) and I’m projecting him to face seven from that side with Schneider and Straw in for Barger and Lukes.
The first problem with playing his strikeout prop (6.5) is that the projected Toronto lineup averages an 18 K% vs LHP with four batters below 15%. At 24 batters, I have Snell at right around 6.5. In order to hit his outs prop (17.5), he can afford six batters to reach base (or basically a 1.00 WHIP), so I don’t think there’s a play there. If Snell is cooking, the Dodgers certainly could let him go past those 24 batters or six innings or he could allow fewer base runners. While Snell posted a 10.2 BB% this season, he’s walked just 10 of his last 142 batters (7% in six starts), including the post-season. It’s tough to find confidence in any of his props.
Not shocking, but at least slightly surprising Trey Yesavage gets the Game One start after Kevin Gausman threw some pitches in Game Seven of the ALCS on Monday. Yesavage has so far proven his ability to meet the moment with two strong post-season starts out of three. He has already made just as many starts, pitched one more inning and faced one fewer batter in the post-season than he did in the regular season for the Blue Jays.
However, Yesavage’s post-season 24.6 K-BB% is a bit closer to his combined minor league 30.6% this year than his 14.5% major league regular season mark. In three starts during the regular season, Yesavage walked seven of 62 batters, but struck out 16 with a 15.5 SwStr% that suggests bigger things may be possible. His 64.5 HardHit% was an issue, especially if he’s going to continue walk batters the way he has in the minors (10.5% combined). He’s walked seven more of 61 in the post-season, including three in both starts against the Mariners.
But first, Yesavage was more Ye Savage than Yes Average when he struck out 11 of the 18 Yankees he faced over 5.1 no-hit innings in his division series and first post-season start. Bringing his 94.7 mph heater at 19 inches of iVB, an inch below his regular season average, Yesavage generated 11 of his 18 whiffs on just 29 splitter thrown and then another five on just 14 sliders. His 45 CSW% (Called + Swinging Strike) was pure dominance. The hard hit rate wasn’t an issue with only six batted balls in play.
Yesavage’s first start in the ALCS wasn’t even Yes Average. In fact, it was probably his second worst start since being called up, walking three Mariners as mentioned, striking out four in as many innings with five runs allowed. Seven batted balls exceeded a 95 mph exit velocity, while he garnered just seven whiffs over 70 pitches, no more than three on any one pitch. His velocity was down 0.6 mph, slightly affecting his spin, but not his elite iVB (20 inches) at all. The Mariners didn’t swing and miss on any of the 12 they took on fastballs inside the strike zone.
Although Yesavage also walked three Mariners in Game Six, he much more resembled his ALDS start against the Yankees, striking out seven with just five hard hit batted balls turning into a pair of runs over 5.2 innings. With the fastball down 1.0 mph now and 74 RPM, but still 20 iVB, Yesavage didn’t get a single swing and miss on any of the 29 he threw, but he did generate 10 whiffs on 31 splitters and another five on 27 sliders.
I would be concerned about his fastball against the Dodgers, but he’ll have to throw it in order to keep getting chases on his other pitches. Yesavage had a small sample reverse split in his three regular season starts, but I can’t find where to figure out if that has continued in the post-season, though the Dodgers may be the first lineup he’s faced this month with more RHBs than LHBs (Ohtani, Freeman, Muncy, Edman).
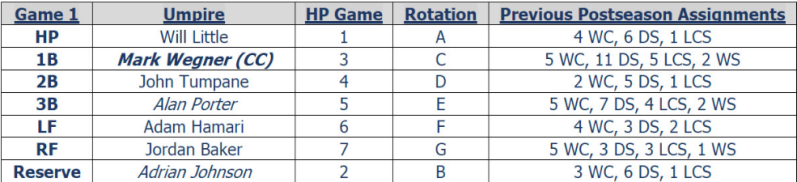
With temperatures below 60, I’d expect the roof to be closed in Toronto, making it a just below neutral run environment, while game one plate umpire Will Little could be described similarly.
While I project Snell nearly two-thirds of a run better than Yesavage on average, both are volatile pitchers and the latter much more volatile over his six total starts with Snell seemingly on a heater with improved control. As mentioned in the main series preview, the largest Toronto advantage is going to be defensive. While both bullpens have been awful this post-season, the Dodgers are more likely to rely on theirs much less (goes for this game and series).
While we’ve also discussed the offenses in the wider series preview, there is one aspect that will help the Blue Jays a bit in the first two games in this series and part of the reason I show a slight bit of value on them. The Blue Jays have an 18 point home/road wRC+ edge on the Dodgers. The Blue Jays had the fourth highest home wRC+ this year. The Dodgers were more middle of the pack (12th) on the road.
That said, a lot of it was George Springer’s 183 wRC+ at home this year with nobody else in the projected lineup above 121, though Vlad and Clement also exceeded a 145 wRC+ vs LHP this year. Ohtani was one of three projected Dodgers above a 105 wRC+ on the road this year. Of course, all three were above 130, but Kike, Pages and Edman were also below 70. In their home games in this series, I will put the Toronto offense on par with the Dodgers.
Thus, I do have the Dodgers only slightly favored in the opener and see some value on the home dog. They are +130 both for the full game and F5 in which I see similar value. I also make the total almost eight and a quarter, BUT that’s under a normal expected environment, where starting pitchers have their normal leashes and both bullpens are pitching three plus innings. In the first of seven, both teams will give their starters a longer leash than later games, but I still don’t see as much value in this number (7.5) as I would the regular season.
G1: Blue Jays (+130) FD 0.5u – I’m not locking this in now though because I want to see if either site comes up with a decent promo before then and am not worried too much about line movement.
Dodgers @ Blue Jays (G2)
Yoshinobu Yamamoto allowed a single run or less in each of his last five regular season starts. He allowed a single run in each of the first three, but finished with two shutout outings. After a four game stretch where he struck out six batters each time out, he struck out exactly 10 in each of his next three before seven in each of his last two. He had a three game stretch allowing four hits each, followed by one hit allowed in three straight games before finishing the season in a start with…four hits. Perhaps most importantly, he finished the season two outs shy of seven straight quality starts (because he walked six Giants) and completed at least seven innings in four of those starts.
Increasing his workload and becoming the work horse for this team, while retaining a 20.8 K-BB% this season is sure to get Yamamoto some Cy Young attention, likely a top five vote getter. Add in the contact profile (52.8 GB%, 5.7% Barrels/BBE) and his 2.73 xERA is only a quarter run removed from a 2.49 ERA, though the .243 BABIP is probably not sustainable and more than 40 points below what the Dodger defense allowed.
Yamamoto dominated his WC game against the Reds, striking out nine of 28 batters with two unearned runs early. His fastball was up 0.7 mph (96.1) with more spin, but the same 16 inch iVB. He got seven swings and misses on 32 curveballs and a total of 10 on his other 81 pitches. The curveball and fastball each accounted for 15 called and swinging strikes over a combined 76 pitches for an amazing 39.5 CSW%.
Yamamoto had the rare post-season clunker for the Dodger rotation in his NLDS start against the Phillies. He only walked one, but also only struck out two and allowed three runs over just four innings, while allowing six hits and seven hard hit batted balls. The fastball was up 0.4 mph in this start, while he generated just a 27 CSW% (called + swinging strikes) overall. Batters made contact on all five swings at his splitter.
With a complete game, three-hitter, Yamamoto quelled any concerns in the NLCS. He struck out seven Brewers with a solo home run to lead off the game was his only blemish. He may have been a bit fortunate with 11 hard hit batted balls, though he only walked one. The fastball was up 0.8 mph in this one, while he generated eight of his 15 whiffs on the splitter, throwing it in the strike zone only 32% of the time.
In three post-season starts, he’s averaged 26.3 batters faced, though his 17.7 K-BB% (ironically about what Toronto starters have averaged this post-seaosn) is slightly below his 20.8 K-BB% during the regular season and his hard hit rate is up, but with more ground balls (58.2%).
Yamamoto will likely be facing a slightly different lineup than Snell, one which has included five RHBs, but has held batters from either side of the plate to no higher than a .290 wOBA or xwOBA with a 40 to 50 point reverse split. Daulton Varsho is the only Toronto hitter who has hit his pitch mix well this season though. Most Toronto bats have a negative pitch run value matchup against him.
This season, only Kevin Gausman’s FIP and pitch modeling were better than his 3.59 ERA, though no estimators reached four. While his 17.9 K-BB% was a bounce back from 14% last season, it was nowhere near his 23.9% average the previous four seasons. However, he did post a 21.3 K-BB% over his final 13 starts.
In his first post-season start, against the Yankees, Gausman dominated with his usual mix of fastballs and splitters, only throwing four sliders. He was up 0.8 mph to 95.3 mph in that start, his fifth highest velocity of the season. While only collected a single swinging strike on the pitch (spin and iVB were actually down), it set up 10 whiffs on 17 swings against the splitter. Gausman struck out only three Yankees, but was shutting them down until running into a bit of trouble and getting pulled in the sixth.
He pitched another 5.2 innings in Game One of the ALCS, allowing just two runs and striking out five, walking a single batter with three hits. This time, Gausman threw 12 sliders and just 27 splitters, still generating five of his 10 whiffs on 14 swings against the pitch. The fastball was up 0.9 mph here, but also with increased spin and iVB (18 inches).
Gausman’s second start of the ALCS was…another 5.2 inning outing. He only allowed three hits, but as many walks with four strikeouts. A solo home run was the only lasting damage. For the first time this post-season, Gausman’s velocity was down from his season average (-0.3 mph), also losing 72 RPM and 1 inch of iVB. As a result, none of his 15 whiffs came on the heater with 13 on the splitter he threw 11 more times than his declining fastball.
He also faced five batters in relief in Game Seven and walked three without a strikeout. This dropped his post-season K-BB to 4.2% in 18 innings. His saving grace has been a lack of hard contact. He had just a 9.2 K-BB% prior to the relief outing.
Gausman retained his career reverse split in 2025 with batters from either side of the plate below a .290 wOBA, but with .298 and .316 xwOBAs. I don’t like his matchup with the Dodgers. (Well, I don’t like anyone’s matchup with the Dodgers, but you know what I’m getting at.) As with Yesavage on Friday, he’ll likely be facing a lineup with a 123 wRC+ and .204 ISO vs RHP this year and 121 wRC+ average this post-season. The other problem is that the big three plus Muncy and Pages all have solid to great numbers against splitters (though likely a small sample).
With temperatures potentially not exceeding 50 degrees on Saturday, expect the roof to be closed again, though Adrian Johnson is a moderately hitter friendly umpire, perhaps pushing the 98 park run factor a bit past neutral.
I have Yamamoto about four-fifths of a run better than Gausman. As was written yesterday and in the series preview, the largest Toronto advantage is going to be defensive. While both bullpens have been awful this post-season, the Dodgers are more likely to rely on theirs much less (goes for this game and series).
While we’ve also discussed the offenses in the wider series preview, there is one aspect that will help the Blue Jays a bit in the first two games in this. The Blue Jays have an 18 point home/road wRC+ edge on the Dodgers. The Blue Jays had the fourth highest home wRC+ this year. The Dodgers were more middle of the pack (12th) on the road.
That said, a lot of it was George Springer’s 183 wRC+ at home this year with nobody else in the projected lineup above 121, though Vlad and Clement also exceeded a 145 wRC+ vs LHP this year. Ohtani was one of three projected Dodgers above a 105 wRC+ on the road this year. Of course, all three were above 130, but Kike, Pages and Edman were also below 70. In their home games in this series, I will put the Toronto offense on par with the Dodgers. (Yes, a lot of his has been repeated from Game One).
I project this game similarly to Game One with the Dodgers as small road favorites, though with a slightly higher total, closer to eight and a half (umpire influence), again, before adjusting for the post-season environment (runs are tougher to come by in the post-season, as offenses generally decline nearly 10% by wRC+). If there is more to be said, it will be said after Game One ends and we have more information about Game Two.
Post G1 Update: Maybe we should scratch that post-season offensive penalty. But more seriously with the small umpire bump, I think the 7.5o is worth a shot.
Blue Jays @ Dodgers (G3)
Just a short note on updated stats after the first two games. The Blue Jays now have a 138 wRC+ this post season and the Dodgers 107. The Dodger bullpen has a 5.29 FIP/5.65 xFIP/5.43 SIERA combination for an average 5.46 in the post-season, worst among playoff teams by nearly half a run after their disastrous effort in game one. The Blue Jays (5.59/4.68/4.08 – 4.78) have remained stably the third worst pen. It was easier just pointing that out rather than reposting every chart for those few numbers.
The Blue Jays are switching it up and starting Max Scherzer in game three after pithing game four of the ALCS. While Scherzer hadn’t pitched in a major league contests since September 24th, he had been staying ready by pitching simulated games of more than 90 pitches and was able to throw 87 pitches against the Mariners.
After a long IL stint took away April, May and almost all of June, Scherzer quickly found a groove with a 26.2 K-BB% over a six start stretch starting with his second game back. He then dipped to 8.4% over his next five, but did finish up with a 17.1% mark over his last four starts. Still, a 16.5 K-BB% was his worst mark since 2011 in Detroit. His 93.6 mph average velocity wasn’t his best, but still fine when compared to his career average (93.8). Where Scherzer was at his career worst was a 38.2 HardHit%, which is still right around league average, but with another career worst in ground ball rate (27.1 GB%, five points below 2024’s previous career worst), Scherzer allowed 12.4% Barrels/BBE. With increased contact overall and increased elevated contact, that’s 31 barrels over 85 innings. In fact, 8.7% of the batters he faced (not 8.7% of batted balls) barreled Scherzer up this season and that is the main concern. It’s the reason Scherzer’s 4.99 FIP and 4.79 xERA nearly matched his 5.19 ERA. A 4.29 SIERA was his only estimator below four and a half. A 73.8 LOB% was also his worst since 2011.
While Scherzer was up 0.6 mph (94.2) in Seattle and struck out five of 22 batters he also walked four. Though he only threw it 10 times, the curveball was responsible for six of his 10 whiffs. The fastball got four of the remaining six with another eight called strikes on 45 thrown. His usually reliable slider only generated two whiffs on seven swings (16 thrown). Sherzer only allowed three hits, but six hard hit batted balls, including one home run. The home run allowed to Naylor in the second inning would have been out of 12 of 30 parks with a 102.6 mph EV, but 31 degree launch angle. Scherzer hung one and it barely cleared the wall.
LHBs blasted Scherzer for a .360 wOBA and .375 xwOBA this year, while RHBs were around average (.329/.307). Doddger lineup that was posted for the first two games, they’ve averaged a healthy 123 wRC+ and .204 ISO v RHP this year and a 112 wRC+ overall this post-season. Only Edman and Kike appear to have neutral or worse pitch run value matchups against Scherzer here, which is a combination of the frequency and results on pitches Scherzer has thrown and results of Dodger batters against those pitches.
This is a very dangerous spot for Scherzer and his results against the Mariners in the most pitcher friendly environment in baseball may have overstated the actual performance. Batters had a .321 xwOBA in that game against him, which is league average stuff and because of the four walks, his estimators all exceeded five.
The 90.1 innings Tyler Glasnow threw for the Dodgers this year are his least since 2022, but third most since 2019. However, his 17.2 K-BB% is worst since his early Pittsburgh years. However, a 37.4 HardHit% was one of the best marks of his career.
The pitch modeling is absolutely terrible. His fastball usage, velocity and pitch model grading all declined this year even though it was still an above average pitch. He did pick up an average sinker this year, but the largest decline in pitch grading were his secondaries (slider, curveball), which were both well below average by either PitchingBot or Pitching+ standards. Overall declines in command (47 BotCmd, 91 Location+) were a major reason why.
The good news is that Glasnow doesn’t have another estimator reaching four with a 3.24 xERA nearly matching his 3.19 ERA. Additional estimators were a bit higher (.225 BABIP). Glasnow faced eight Phillies, striking out and walking two each in 1.2 innings of relief and then struck out eight over six two-hit innings in his ALDS post-season start thus far to put the Phillies away. He was up a full mph in that start, averaging 96.7 mph or better for just the third time all year. In fact, he has no other starts averaging above 96.1 mph on his fastball. The pitch generated seven whiffs on just 10 swings. A full 40% of Glasnow’s 83 pitches were either called or swung through strikes.
Glasnow also closed out the NLCS, allowing his first and only post-season run against the Brewers over 5.2 innings. He did walk three, but only allowed three hits with eight strikeouts. The Brewers only made hard contact on five batted balls, only two of which were even between a -13 and 45 degree launch angle. The velocity was also up in this start, though not as much (0.6 mph), though he threw his sinker and slider more often, generating 14 whiffs on 99 pitches, no single pitch more than six (slider). The biggest magic trick he pulled was getting the Brewers to only swing at 45% of his pitches in the strike zone. Glasnow’s 49.1 Z-Swing% this post-season is best among pitchers with at least 10 innings pitched. His 59.3% mark during the regular season was fourth best among those with at least 70 innings pitched.
Toronto had the fifth highest team Z-Swing% this season (66.6%) and highest by nearly three points this post-season (69.2%). It may not be something Glasnow can rely upon again, especially with the umpire information we’ll get to in a minute.
According to wOBA, Glasnow had just a three point split with batters from either side of the plate within two points of .265. Statcast opens that up a bit more with LHBs (.308) better than RHBs by 36 points of xwOBA. The projected Toronto lineup (w/o Bichette) averaged a 112 wRC+ an .175 ISO vs RHP this year and a 139 wRC+ this post-season. Even in a down year for Glasnow, Vlad and Springer are the only pair who have positive pitch run value matchups against him this year (does not include post-season).
Standard Los Angeles weather expected with one of the most power friendly (especially to RHBs) parks in the league playing as a slightly positive run environment (102 Run Factor via Statcast 3yr). Another factor is Umpire Mark Wegner leaning more hitter friendly than any umpire in the series yet.
We know the biggest (and only edge) the Blue Jays have over the Dodgers is defensively. It’s a large gap between the best defensive team in the league and an average one. It even gets a little larger if IKF is in for Bichette again. Neither set of fans wants to see their bullpen in the game and I don’t think we should skip over the loss of Vesia in this series, especially with the success Toronto LHBs have had against Snell and Banda so far. Snell threw Adddison a rare meatball, so we won’t expect that to continue, but with Scott also down, LA’s second option against LHBs is now…Kershaw?
With the Blue Jays owning a 120 wRC+ at home vs the Dodgers’ 102 on the road, I had the offenses very close. Now their 105 wRC+ on the road is 20 points behind the Dodgers at home (125) giving the home team the clear offensive edge.
Now the difficult part. If I combine regular season and post-season numbers, I get Glasnow at more than a run advantage. If we want to say that these pitchers are much healthier in the post-season and looked such, the numbers underneath the hood would bare that out for Glasnow, not so much for Scherzer, aside from the small tick up in velocity, though it was also only just one start.
What do you weight differently? What do you do about bullpens? The Dodgers can’t be that bad, can they? You’ll only see the bad relievers if they’re losing or pitch poorly or the game goes long. Who’s the Vesia bridge to Sasaki now. I don’t think Glasnow is going more than six.
If I leave everything else as is and take a half run off the Dodger bullpen, I can still get to near 10 runs here. As mentioned earlier, I don’t think the Blue Jays are going to let Glasnow slip a bunch of fastballs by them and I don’t think Scherzer, at this point in his career, is a good matchup with the Dodgers. Add in some umpire help and I do really like the eight run total. I’m very much aligned with the F5 market for this game, but can see a bit of value on the Blue Jays above +160 for the full game. It’s currently at +172, but I’m going to wait on that.
Over 8 (-118) (DK or FD) 1.18u
Post-season bullpen stats...
Blue Jays @ Dodgers (G4)
Shane Bieber was impressive enough in rehab for the Guardians to receive something of value for him in July and that carried over to a 36.6 K-BB%, averaging 92.7 mph on his fastball (a number he hasn’t averaged in a season since 2021) in his first two starts. Bieber was also allowing a 60% hard hit rate with three barrels, but when only 15 batters put the ball in play in two starts, it’s negotiable.
However, while the hard hit rate continued to remain high (44.9% with 12.4% Barrels/BBE), Bieber’s K-BB dropped to a league average 12.7% over his last five starts with his fastball dropping slightly (92.5 mph), still well above any season since 2021.
Pitch modeling, which was better than a 4.00 Bot ERA and 100 Pitching+ in his first two starts, dropped to 4.59 and 97 over his last five as well.
As a result, both Bieber has very league average pitch modeling with a 3.57 ERA aligned with his contact neutral estimators (3.52 SIERA, 3.35 xFIP, 3.42 xERA), despite contact inclusive estimators much higher (4.47 FIP, 4.57 xERA). How this is possible is eight of 14 barrels leaving the park for a 21.1 HR/FB with just a .245 BABIP and 84.3 LOB%. It all evened out. Beiber’s best BABIP came in the pandemic shortened season (.267), but has never otherwise been below .287 and his hard hit rate has been worse than league average, every season of his career after his rookie campaign.
Bieber was smoked for five hits and there runs over just 2.2 innings against the Yankees in the ALDS. He allowed more hard contact (nine batted balls) than he generated whiffs (five) over 54 pitches. The fastball was up 0.6 mph, but generated no whiffs and four hard hit batted balls. The slider was responsible for four whiffs on six swings.
In the best pitching environment in baseball, the Mariners saw a much better version of Bieber in Game Three of the ALCS. Leading with 30% sliders this time, Bieber generated seven of his 17 whiffs on the pitch, while the fastball at it’s 92.6 mph season average, was able to gain four more whiffs with only five hard hit batted balls against all pitches. With Bieber’s velocity slipping to 91.6 mph in the fifth inning, he didn’t throw a single fastball among his nine sixth inning pitches. He left with eight strikeouts and just one walk over six four-hit innings, in which he allowed just two runs.
You can expect some volatility in a pitcher’s first season back from Tommy John and that’s what Bieber gave us on this post-season ride. Game Seven of the ALCS, back in Toronto, saw him last just 3.2 innings, though he struck out five with one walk. He did generate another 13 whiffs on 74 pitches, but also six hard hit batted balls with an average exit velocity of 95 mph off his slider. The velocity sat at 92.5 mph, thought seven of his 13 whiffs were still on the slider.
An interesting aspect is that Bieber has allowed a 24 point career standard split, occasionally getting himself into trouble with LHBs. However, this year he posted a massive reverse split with LHBs below a .290 wOBA and xwOBA, but RHBs more than 100 points higher. With increases cutter and changeup usage, perhaps this would be the expected effect, if he didn’t still only throw those pitches 25.5% of the time combined. His 18.6% curve usage is also his highest rate since 2021 though. Now we’re at three platoon busting pitches at nearly 45% usage.
The Dodger strength against his arsenal comes mostly against changeups. The entire projected Dodger lineup projects strongly against that pitch from Bieber, though he makes enough back on other pitches that only Ohtani and Will Smith stand out strongly against his arsenal overall. However, the thing to remember is that the run values (pitch results) were better than the pitch modeling. The Dodgers were the third best offense against both fastballs and sliders. Bieber may want to attack them with the curve, against which they were just middle of the pack.
Shohei Ohtani worked up to a season high six innings and 91 pitches in his final outing in Arizona, as the Dodgers needed to clinch the division, but has had more than a week off since. The good news is that he’s held his elite velocity while pitching deeper into games and posted a career best 28.2 K-BB% with just four barrels and a 34.8 HardHIt% over 47 innings.
He opened the ALDS with the worst version of a quality start, but also only three hits, one walk and nine strikeouts. He generated a whiff on five different pitches with 23 overall, eight on 36 fastballs.
Nearly two weeks later, Ohtani made his only other start of the post-season, in Game Four of the NLDS, throwing a season high 100 pitches and six different pitches at least nine times. All but the curveball, which got just two swings, generated at least one whiff (19 total). The fastball did drop from 99 mph over the first three innings to 97.5 in the sixth and seventh, but averaged out at 98.5 (0.1 mph above season average). Without any additional iVB, the pitch was up 96 RPM in spin rate. The Brewers only connected at 95 mph or better four times.
Odd to think that in just two starts, Ohtani has already faced 20% of his batters in the post-season. He’ll also have another 11 days between starts here, though it’ll be hard to improve on his 42.2 K% in October.
RHBs had some actual success against him (.295 wOBA), but that dropped to a .257 xwOBA. He’s been better against LHBs, but only George Springer has a positive pitch value matchup against him. Even that’s mostly because of very strong numbers against sinkers and cutters, which Ohtani only throws 13.9% of the time combined. Unlike Glasnow, Ohtani gets most of his strikes on swing throughs inside the zone (82.1 Z-Contact%) rather than takes and a 30% chase rate (28.1% is league average).
Tuesday will bring us a more pitcher friendly umpire in John Tumpane, though not significantly so. The temperature may be up near 10 degrees into the high 70s through most of the game.
With Bichette back in the lineup, the Blue Jays sacrifice something defensively, but they’re still so good in other spots that it’s still a massive edge and Toronto’s only one here. Neither set of fans wants to see their bullpen in the game and I don’t think we should skip over the loss of Vesia in this series, especially with the success Toronto LHBs have had against Snell and Banda so far. Snell threw Adddison a rare meatball, so we won’t expect that to continue, but with Scott also down, LA’s second option against LHBs is now…Kershaw? Or Dreyer? The latter was actually pretty good this season, but has walked two of the seven batters he’s faced this October with one strikeout.
With the Blue Jays owning a 120 wRC+ at home vs the Dodgers’ 102 on the road, I had the offenses very close. Now their 105 wRC+ on the road is 20 points behind the Dodgers at home (125) giving the home team the clear offensive edge.
We’ve seen good, bad and in between in just three post-season starts from Bieber. We’ve seen almost nothing but greatness from Ohtani nearly every time he’s taken the mound this season and post-season. I give him an edge of a run and a quarter here.
While I still got to nearly 10 runs on Monday even taking half a run off the Dodger bullpen with a hitter friendly umpire (though he actually cost the Blue Jays a big inning with a poor call in the second inning), I’m not reaching nine with the same method on Tuesday. That may still turn into an over lean, but we won’t find out until Monday’s game is over. I make the Dodgers larger favorites on Tuesday than Monday too, near -200 for the F5 and about -150 for the full game. However, I’ve been passing on small edges on the Blue Jays because I don’t think the we’ll see much of the bottom of the Dodger pen in close games and I already have series positions on the Dodgers. Will post below if anything interesting breaks when the market opens on Game Four.
Below, these last two graphics are pitch matchup ratings, explained here. It uses pitch frequencies and run values both for the pitcher and the opposing offense and then attempts to add in pitch modeling, which sometimes differs from actual results.
Blue Jays @ Dodgers (G5)
Writing this as Game Four is about to begin, no matter what happens the rest of the way, even if the Dodgers end up sweeping at home, the Blue Jays have proven they belong here. They’ve put up more of a fight than many might be comfortable with as a two to one dog. They’ve exceeded expectations, even if they end up winning only the one game.
As this is a rematch of Game One, I won’t repeat a lot of what was covered above, but pick up from there.
While neither pitcher was on their game, walking three each, Trey Yesavage also struck out five and allowed two runs over four inning with four hard hit batted balls and finished with the better overall line. Of some concern, his velocity continued to be down in the post-season (-0.8 mph) and was down to 92.8 mph in his last inning (almost two mph). He was able to generate whiffs on 40% of the swings on both it and his slider (6/15 for each), but also allowed two hard hit batted balls on each pitch. The largest surprise is that Yesavage only threw his spiltter 10 times (13% vs 26.4% in his three regular season starts)
While the strikeout rate has remained healthy enough (34.2%) to make a 12.7 BB% not so concerning in four post-season starts now (.277 xwOBA allowed), the continuing drop in his fastball velocity is something to watch. Starting all the way back in A ball with 33.1 innings, Yesavage has now thrown a total of 229 innings in his first year in professional baseball after throwing 93.1 innings for East Carolina last year.
The big three (Ohtani, Betts, Freeman) all stand out strongly against Yesavage’s arsenal, but we’re only looking at his small sample of three regular season starts here, not to be taken too rigidly.
After allowing a total of two runs over his first three post-season starts (21 IP), the Blue Jays got to Blake Snell for five runs in just five innings. He struck out just four and walked three with the big blow coming off the bat of Daulton Varsho in the fourth, the first home run Snell has allowed to a LHB all year, a 109 mph shot that would have been out of 29 of the 30 parks after Alejandro Kirk had lasered one that would have been out of five parks. Kirk and Varsho had four of the five hard hit balls against Snell.
That stain on his ledger still leaves Snell with a dominant 25 K-BB% and 63.6 GB% this post-season, numbers that likely would earn him a Cy Young over a full season.
The big question in the first three games of the series was whether Bo Bichette would play or not. He has in three of the first four now, but the new question is whether George Springer will be ready to go. Isiah Kiner-Falefa is getting more plate appearances than Toronto expected in this series.
Assuming Springer sits, Davis Schneider would have the best pitch run value matchup against Snell’s arsenal with Vlad, Kirk and Varsho also grading strongly. Funny how that worked out for game one even though post-season stats are not counted here.
Temperatures may again be near 80 degrees to start the game for a second consecutive day in Los Angeles, dipping into the mid-70s during the middle innings. Alan Porter is a very slightly hitter friendly umpire, something I wouldn’t even bother mentioning during the regular season.
George Springer’s absence would push Bo Bichette to DH, leaving the Toronto defense at full strength, still their largest edge in this series. The loss of Springer would dip the base running factor in favor of the Dodgers, whose 125 wRC+ at home this year (Toronto 105 on the road) adds to their otherwise smaller offensive edge.
Amazingly, the 18 inning game on Monday brought the Dodger pen estimators down almost a full half run, now averaging just below five for the post-season, while the Blue Jays move behind them, 0.1 runs per nine worse. Let’s face it, even if both pitchers throw complete games on Tuesday, both bullpens may still be exhausted on Wednesday. It’s a strength for neither team, but Snell’s ability to pitch deeper into the game than Yesavage may be a significant edge, more than the half run edge I’m already giving the veteran over the rookie based on their season and post-season numbers to this point.
Yet, with the possibility than any or every one of the last three games could be an elimination game for the Jays (if they lose Tuesday), it would be an all hands on deck situation after covering 18 innings. It seems like an impossible situation, yet I also see Yesavage vs Snell as the best matchup for the Jays in this series, which is why I played Toronto in game one and only have the Dodgers as moderate home favorites here with a total slightly above nine.

Dodgers @ Blue Jays (G6)
I don’t suppose many thought we would get this far, even fewer with Toronto in the driver’s seat, ready to win their first World Series in over 30 years with one more win. I didn’t even leave room for a game seven. It wasn’t an impossible task. Two to one dogs regularly win games several times a week during the regular season. To use the old batting average analogy, getting a hit every third time to the plate will put you in the Hall of Fame. Lastly, it’s not always the best team that wins any post-season series, though the longer the series, the more in favor of the favorite. Just look at BABIP here. The Blue Jays, .297 in this series. The Dodgers, .236. The Blue Jays have a team .327 xwOBA in this series and the Dodgers .323. The Blue Jays have a team 4.13 xERA in this series, the Dodgers 4.24. This has been a very closely contested series, mostly thanks to Dodger inefficiencies in the bullpen, on defense and BABIP.
I’ll start the coverage for game six with this bold statement. If the Dodgers do win this series, Yoshinobu Yamamoto will be the series MVP. After a dominant complete game two, he may have to equal that task to keep the Dodgers alive here, overcoming a shaky defense, struggling offense and keeping the bullpen out of the game.
As with game five, there’s no reason to repeat what’s written above the first time these two pitchers met in this series, but rather, we’d pick up from there.
Of course, it was the complete game, one run effort, striking out eight without a walk in Game Two that everyone was talking about before Game Three went 18 innings and before the Blue Jays took control of the series, winning the last two in Los Angeles. Yamamoto wasn’t untouchable. He did allow eight hard hit batted balls, but the Blue Jays went only two for seven on hard hit batted balls with an xBA greater than .400. It was, perhaps, the one game in the series where the BABIP gods favored the Dodgers.
Still, Yamamoto was very good, up 0.8 mph on his fastball, though leading with his splitter (32%), the pitch that generated more of his 19 whiffs (six) than any other pitch, though the curveball led with a 42 Whiff%, while hard hit rate was evenly distributed among his six pitches with none having more than two or fewer than one. Also, Yamamoto’s fastball was just as strong in the last inning (96.6 mph) as it was in the first (96.9), as he threw just 105 pitches.
You don’t normally see starting pitchers increase their workload in the post-season anymore, but Yamamoto has now faced 111 batters in 28.2 innings across four starts. His 19.8 K-BB% is actually a point below his regular season rate (20.8%), but the ground ball rate (55.1%) is 2.3 points higher.
Kevin Gausman’s Saturday night wasn’t nearly as glamorous as Yamamoto’s, but he also he did break the 5.2 inning streak for the first time in four post-season starts. In his first quality start of the playoffs, Gausman allowed three runs across 6.2 innings. He struck out six without a walk and only allowed four hits, but two of them left the park. Will Smith’s shot would have left all 30 parks, but Max Muncy’s was a home run in less than half of them (13). Gausman did allow another seven hard hit batted balls.
As for the minutiae, Gausman’s fastball was only 0.1 mph removed from his season average and he led with it 60% of the time, though it only generated three of his 11 whiffs and was responsible for eight of his nine hard hit batted balls. The splitter (35%) garnered eight whiffs on 13 swings. He only threw four sliders.
The 193 innings Gausman threw this year were already a career high before adding the additional 24 post-season innings and while the extra work hasn’t left him any worse off from a surface perspective, the K-BB is down to 9.5%, nearly half his season rate (17.9%) with a 5.8 point drop in ground ball rate (30.9%).
With temperatures in the 40s and rain potential, the roof will be closed in Toronto (98 Park Run Factor Statcast 3yr), while Adam Hamari is a moderately pitcher friendly umpire.
The Toronto defense has displayed their superiority in this series or, rather, the Dodger defense has displayed its inferiority. No more excuses for the Dodger bullpen either. We’re 15 games into this thing and they are what they are. Initially, the thought was the starters getting the ball to the high leverage relievers, but there’s been plenty of Treinen and friends in this series and to be honest, not even Sasaki has strong peripherals. Sheehan the unheralded (pauses to look up his name)…Will Klein have been the only relievers that have looked good in this series. I’ve mentioned the loss of Vesia could be a problem in this series and Banda has not held up in his stead.
You may not believe me after that performance, but the Dodgers had a 125 wRC+ at home this season, which drops to 102 on the road. This supposed edge for Toronto (120 at home) should bring offensive expectations back into balance. The Blue Jays may not have George Springer again for Game Six (in fact, I’m projecting him out), but it’s really only like they subbed in Bichette for him in this series and this team now has a 129 wRC+ this post-season (128 for the G6 proj. LU). At 101 (111 G6 proj. LU), the Dodgers have slipped into a tie with Seattle for the second best offensive performance this post-season. The Dodgers do gain a significant base running edge with Springer out (six BRR better than Bichette), as much as that matters.
In Game Two, I had Yamamoto four-fifths of a run ahead of Gausman and I stand by that after their performances in that game.
Throughtout the series, I’ve been skipping on what I perceived as Toronto edges in the market, except for G1, that I would have played during the regular season for a couple or reasons. First, because I had enough futures still alive that I didn’t want to overextend myself or accidentally put myself in a no-win situation. Secondly, because I kept believing I was missing something that caused me to project the Dodgers as smaller favorites than they were with their starters pitching deep into games for a change. I was wrong. Or, rather, I was right, depending on your perspective. Well, that ends here.
But that’s only because I don’t perceive an edge large enough to be actionable. I have the Dodgers as small favorites (which I’ve projected for every game in Toronto so far), which nearly aligns with the market. I’m closer to +110-ish than the market’s +124, but I’m generally looking for closer to a 3.5% edge and this is just below three. It’s borderline, but not something I would play in the regular season, when there are many more games.
With the closed roof and pitcher leaning umpire, while both teams effectively have their “Ace” on the mound, I’m finally below eight runs for the first time in this series (maybe the second), which also aligns with the market.
That’s all for now and maybe even the season. If there’s a G7…I guess I’ll have to find some room for it.
LEGEND
Opp wRC+ Opposing offense’s wRC+ against L/RHP this season (in first graphic)
DEF Projected lineup(Roster Resource) Fielding Run Value & Team Runs Prevented now both in first graphic
Bullpen SIERA/xFIP/FIP average over the last 30 days (because there’s so much bullpen turnover)
BSR: Projected Lineup Base Running Runs also in first graphic
Don’t hesitate to ask about anything else that’s unclear.
Follow @FreelanceBBall on Twitter and Bsky.app
Add comment
Comments