With Toronto’s win on Wednesday, we were guaranteed two more days of multiple baseball games, potentially ending on Friday. In fact, depending on what happens Thursday night, this could still be the final game of both series or just the middle.
It was quite foolish of me to promise written content for all days with multiple games because I kept failing to realize that we’re in an era where some teams (generally Milwaukee here) refuse to divulge their pitching intentions.
I’m writing this as the Brewers and Dodgers are in the first inning and I have no idea what the Brewers are going to do until we see who pitched in Game Three and then guess who’s available in Game Four. One interesting thing is that they’ve flipped the games around, starting at 6 PM ET/3 PM PT in Seattle on Friday. Shadow coverage will depend on the roof status. Although only Miller is confirmed at this time, I’d assume the Blue Jays are coming back with Gausman.
Remember, we are using post-season stats instead of Opp L7 days in the first chart directly below and for bullpens as well. Also, L30 days for pitchers in the K/SwStr chart are post-season numbers now too.
All stats through the regular season unless otherwise noted. Legend at the bottom of the page.
If you find the information on this site helpful, the tip jar is open at mtrollo86@gmail.com on Paypal.
Blue Jays @ Mariners
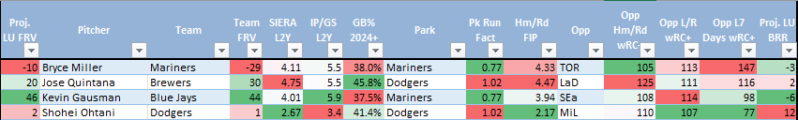
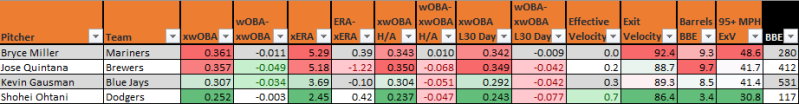
This season, only Kevin Gausman’s FIP and pitch modeling were better than his 3.59 ERA, though no estimators reached four. Gausman retained his career reverse split in 2025 with batters from either side of the plate below a .290 wOBA, but with .298 and .316 xwOBAs.
In his first post-season start, against the Yankees, Gausman dominated with his usual mix of fastballs and splitters, only throwing four sliders. He was up 0.8 mph to 95.3 mph in that start, his fifth highest velocity of the season. While only collected a single swinging strike on the pitch (spin and iVB were actually down), it set up 10 whiffs on 17 swings against the splitter. Gausman struck out only three Yankees, but was shutting them down until running into a bit of trouble and getting pulled in the sixth.
He pitched another 5.2 innings in Game One of the ALCS, allowing just two runs and striking out five, walking a single batter with three hits. This time, Gausman threw 12 sliders and just 27 splitters, still generating five of his 10 whiffs on 14 swings against the pitch. The fastball was up 0.9 mph here, but also with increased spin and iVB (18 inches).
Gausman has the second best pitch modeling on the board behind Ohtani. The Mariners ran out six LHBs (Rivas for Robles) in Game Four, but may want to pull that back against Gausman’s reveres split. However, with Rivas in the lineup, everyone projected has at least a 119 wRC+ vs RHP this season with each of the first seven above a .175 ISO.
Over 12 starts since the beginning of May, interrupted for over two months mid-June, Bryce Miller struck out only 43 of the 263 batters he faced and 11 of those came in one start against the Angels, who were averaging 30% strikeout rates throughout their lineup at that point in the season. The 10.2 K-BB% was easily a career worst for a guy who posted 17.3% and 17.9% marks over his first two seasons. Also a career worst, his 48.6 HardHit%, resulting in an unpleasant 5.29 xERA. Miller’s pitch modeling (4.36 Bot ERA, 98 Pitching+) were his only estimators below four and a half. Still, pitch model grading on every single one of his pitches declined this year.
At home, Miller’s K-BB sat at just 12.4% this year, which is actually near his career road mark (12.5%) and 6.5 points below his career rate at T-Mobile in Seattle. In a stunning development, batters at home had a .351 wOBA against Miller this year vs .347 on the road. For his career, he’s still 39 points of wOBA better at home.
Clearly, Miller was pitching injured for part or even most of the season. That’s why it was a big surprise when he came out firing 96.1 (up 1.3 mph) against the Tigers in the ALDS. His best game average velocity of the season by 0.2 mph. Perhaps it was also because Miller threw just 55 pitches and only his fastball (24) more than 10 times. He struck out two and did not walk anyone, but was quickly pulled in the fifth with two runs on the board.
The shorter ALDS outing allowing the Mariners to bring Miller back on three days rest to start the ALCS against the Blue Jays. This time he was up 1.4 mph on 29 fastballs, but down one inch of iVB (18). He generated three of his eight whiffs on the heater and another three on the splitter, finishing with a 26 CSW% (called plus swinging strikes) on 76 pitches.
All batters were above a .335 wOBA and xwOBA against Miller this year with LHBs within three points of .370. Perhaps a bit healthier now, we’ll see more results like Game One of the ALCS, where he did walk and strike out three each, but allowed just two hits and a single run over six innings. The moving piece in the Toronto lineup has been Anthony Santander. He’s gone from bottom of the order to scratched with a continuing back issue to middle of the order to out again on Thursday night. Projecting him out again Thursday would drop the projected lineup strikeout rate to 16.9% against RHP this season with a 112 wRC+ and .175 ISO. These nine have also averaged a 133 wRC+ in the post-season, busting out in Game Three of the ALCS after going quietly at home.
Temperatures are expected to reach a high of 60 on Friday, some time during this game. It’ll be interesting to see if they decide to keep the roof open and invite the shadows or not. The run environment moves from a league low 77 Park Run Factor with the roof closed to 83 on average with it open. Still last in the league and perhaps even lower with cooler temperatures. Your Game Five ALCS plate umpire, is the nearly neutral Marvin Hudson (the slightest hitter lean).
Despite Miller’s velocity being up this post-season, his peripherals are still pretty marginal and they’re probably not going to improve against these Blue Jays. I’m still favoring Gausman by about a run in this matchup with Toronto also holding a massive defensive edge. Both teams are below average on the base paths, while the Mariners are at home and have the better bullpen with offenses nearly a wash.
I make the Blue Jays small favorites in this game, a bit less than -120 and closer to -135 for the F5. With the roof closed, I also make a total around seven, but would leave room for the chance that I’m underestimating Miller here. We won’t have anything officially on this game for at least another hour yet, but we're just about at the point, halfway through Game Four, where the Blue Jays returning to Toronto with a lead in this series seems more likely than not.

Brewers @ Dodgers
Usage would suggest that this is Jose Quintana’s game. Yet, logic would suggest the Brewers may not want to go down like that. Quintana has terrible pitch modeling and his best estimator is a 4.81 FIP with just 18 of his 40 barrels (9.7%) leaving the park. This, despite a 3.96 ERA. You might counter that Quintana has beaten his peripherals throughout his career. I’d counter your counter with his .259 BABIP being the lowest of his career, his 7.0 K-BB% is only 0.1 point better than his previous career worst, his rookie year in 2012. His barrel and hit hard rates are also the worst of his career in any non-pandemic shortened season.
Previously, Quintana was beating marginal peripherals. Now he’s beating awful ones to a similar degree. It’s completely unsustainable and we might have even seen it this year if he had thrown more than 131.2 innings. Quintana allowed 17 runs over his last 20.2 innings this seaon. Batters from either side of the plate exceeded a .300 wOBA and xwOBA against him. He faced 12 Cubs over three shutout innings in the NLDS, striking out two with one walk, but has not pitched yet in the NLCS.
Maybe the Brewers are better off giving those innings to someone like Chad Patrick (17.3 K-BB% during the regular season), who has struck out six of 18 batters this post season with a single walk and two hits. But it’s really an everyone’s available situation here.
Shohei Ohtani worked up to a season high six innings and 91 pitches in his final outing in Arizona, as the Dodgers needed to clinch the division, but has had more than a week off since. The good news is that he’s held his elite velocity while pitching deeper into games and posted a career best 28.2 K-BB% with just four barrels and a 34.8 HardHIt% over 47 innings.
He opened the ALDS with the worst version of a quality start, but also only three hits, one walk and nine strikeouts. He generated a whiff on five different pitches with 23 overall, eight on 36 fastballs.
RHBs had some actual success against him (.295 wOBA), but that dropped to a .257 xwOBA. He’s been better against LHBs, while the Brewers generally have a balanced lineup, though Jackson Chourio had to leave Thursday’s game with an injury.
Ironically, we’d normally talk about pitchers having a longer leash with a 3-0 lead, but even with two weeks in between starts, we know the Dodgers don’t want to overextend Ohtani. Plus, the quartet of Vesia, Treinen, Banda and Sasaki were quite successful shutting the Brewers down over the last three innings on Thursday. I wouldn’t be surprised if we saw their longer relievers (Sheehan, Wrobleski, Casparius) come in behind Ohtani here, though they’d likely go to one of the lefties and Sasaki again with a chance to close out the series if it’s close.
I’m having great difficulty projecting this game because it’s basically the entire Milwaukee staff (probably minus Misiorwoski) against the Dodgers and maybe Ohtani only for five innings. The best I can come up with is a massive Dodger edge over the F5 (better than 2-1). The Brewers retain their base running edge and defensive edges here, but Ohtani is just so far ahead of whatever the Brewers decide to do here. We do not yet have a F5 line or total.
To be honest, this has been one of the more difficult breakdowns to write. I'm not entirely happy with the way it reads and considered not posting it at all. It feels somewhat rushed because I waited as long as I could to start it because I wanted to know what position the Brewers would be in and who they might use on Thursday.
There's just so much "I don't know". How do even project an ALCS where the road team has dominated every game and pitchers have looked worse in Seattle?
Regardless, I'll back if there are two games Monday or with a World Series preview next. Hopefully it reads better than this. Any additional games of interest will by posted on Action Network (follow Rocky Jade).
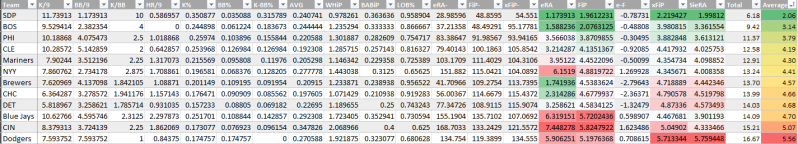
Post-season bullpen stats...
Below, these last two graphics are pitch matchup ratings, explained here. It uses pitch frequencies and run values both for the pitcher and the opposing offense and then attempts to add in pitch modeling, which sometimes differs from actual results.


LEGEND
Opp wRC+ Opposing offense’s wRC+ against L/RHP this season (in first graphic)
DEF Projected lineup(Roster Resource) Fielding Run Value & Team Runs Prevented now both in first graphic
Bullpen SIERA/xFIP/FIP average over the last 30 days (because there’s so much bullpen turnover)
BSR: Projected Lineup Base Running Runs also in first graphic
Don’t hesitate to ask about anything else that’s unclear.
Follow @FreelanceBBall on Twitter and Bsky.app
Add comment
Comments