We’re covering both NLDS Game Fours later today plus ALDS Game Five in Seattle on Friday below. Because I’m running late (we didn’t know who was playing or pitching until late last night), I’ll post as I go today.
A slight change for today with Last 7 Day stats in the first chart and bullpen stats in fourth chart including post-season information now with all teams having played at least three games. It’s not much, but may be better than September numbers. In some areas, we may have to adjust.
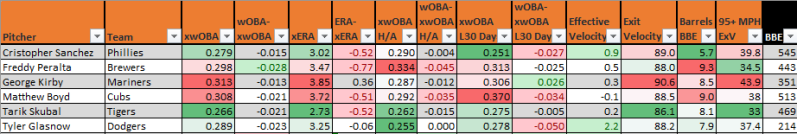
All remaining stats through the regular season. Legend at the bottom of the page.
If you find the information on this site helpful, the tip jar is open at mtrollo86@gmail.com on Paypal.

Phillies @ Dodgers
If Cristopher Sanchez doesn’t finish second in the Cy Young voting, something is wrong. You can’t do much better than a 20.8 K-BB% with a 58.3 GB% with just 5.7% Barrels/BBE and 12 of 32 quality starts of at least seven innings and two runs or less. Sanchez rivals Ohtani for the best pitch modeling on the board and a 3.02 SIERA and xERA are the estimators furthest removed from his 2.50 ERA.
Luckily for the Dodgers, they only really have to play a pair of LHBs against him (Ohtani and Freeman), as batters from that side posted just a .191 wOBA and .245 xwOBA against Sanchez. RHBs were better (.295, .257), but still not good. I’m projecting the same Dodger lineup as Game One, except for the addition of Will Smith. This combination averages a 115 wRC+ and .209 ISO vs LHP with only Edman and Kike below a 100 wRC+.
Sanchez struck out eight of the 24 Dodgers he faced in Game One over 5.2, he allowed four with two walks and collected 69.2% of his contact on the ground. Sanchez is one of the few pitchers who never throws a four-seamer, so we don’t worry about things like iVB. He did collect 12 of his 18 whiffs on just 38 changeups with another six called strikes. A truly dominant pitch. Of the 43 swings taken by the Dodgers against him, 18 were misses.
The 90.1 innings Tyler Glasnow threw for the Dodgers this year are his least since 2022, but third most since 2019. However, his 17.2 K-BB% is worst since his early Pittsburgh years. A 37.4 HardHit% was one of his best marks though.
The pitch modeling is absolutely terrible. His fastball usage, velocity and pitch model grading all declined this year, but it was still an above average pitch. He did pick up an average sinker this year, but the largest decline in pitch grading were his secondaries (slider, curveball), which were both well below average by either PitchingBot or Pitching+ standards. Overall declines in command (47 BotCmd, 91 Location+) were a major reason why.
The good news is that Glasnow doesn’t have another estimator reaching four with a 3.24 xERA nearly matching his 3.19 ERA. Additional estimators were a bit higher (.225 BABIP). Glasnow faced eight Phillies in this series, striking out and walking two each in 1.2 innings of relief. According to wOBA, Glasnow had just a three point split with batters from either side of the plate within two points of .265. Statcast opens that up a bit more with LHBs (.308) better than RHBs by 36 points of xwOBA.
The Philadelphia offense does not travel well (97 road wRC+), but the projected lineup does average a 115 wRC+ and .182 ISO against RHP this year with everyone above a 90 wRC+.
Temperatures near 80 with the wind blowing out and a hitter friendly umpire (Wegner) in an already slightly positive run and very power friendly environment suggest we may see a few more runs than expected between these two pitching studs.
I have Sanchez about three-quarters of a run superior to this version of Glasnow. We can only go by what we’ve seen this year, which is a good, rather than great Glasnow. While there isn’t much separating the offenses vs L/RHP, we have to give the Dodgers the larger Home/Road edge. The only other edge I’d give the Phillies is base running. They have a poor defense (worse without Bader) and I’d adjust the Dodger post-season bullpen down significantly because we probably aren’t going to see the lower leverage guys, who have bombed for them, again in this series. I’d expect both pitchers to have a reasonable leash, even in an elimination game for the Phillies. In fact, he’s probably earned enough trust to have more of a leash than Glasnow. It seems no matter who the Phillies bring out of the pen, they struggle in October. Perhaps it won’t rub off on Duran.
I have this game about even overall with the Phillies as small F5 favorites. With the Phillies small dogs overall and about even F5, I see a small edge there, something that more aggressive players may want to attack, but not enough for me. Considering the conditions, I do see some value in the total. The strikeout rates and Sanchez’s ground ball nature do concern me, but even adjusting the Dodger bullpen down two full runs from their post-season flop, I have this total around 8.5.
Over 7.5 (-122) FD 1.22u
Follow Rocky Jade for more.

Brewers @ Cubs
While Freddy Peralta was as streaky as ever and we will certainly question his 2.70 ERA too (3.47 xERA – 3.94 Bot ERA, though contradicted by a 107 Pitching+), he did end on a hot note with a 30.4 K-BB% over his last six starts, driving his season rate up to 19.1% on the season. And while the 9.2% Barrels/BBE he allowed was the second highest of his career, his 34.5 HardHit% was his best mark in three years, though he’s never been worse than average in his career in that department.
The problem is that Peralta only completed six innings in 13 of 33 starts this year. His high strikeout and walk rates can run up pitch counts. Not really as much as a post-season issue, as the Milwaukee pen has had strong peripherals in this series.
Peralta had just a 16 point wOBA split, though Statcast opens that up a bit to 31 points with LHBs at a league average .313 xwOBA against him. If the Cubs attack him with the same lineup they used in Game One, it will include four LHBs, averaging a 115 wRC+ and .190 ISO vs RHP overall this season.
Peralta exhibited similar stuff to his season averages in Game One, though he did drop an inch of iVB (16) on his fastball. It did not seem to be a major issue, as he struck out nine of 24 Cubs, but with three walks and two home runs. Peralta spread his 14 whiffs through 95 pitches pretty evenly throughout his arsenal.
Peralta did have a 5.7 point K-BB Home/Road split with batters gaining 37 points of wOBA, but still below .290 against him on the road. One thought is that Milwaukee has become one of the most negative run environments in the league in recent years, but so has Wrigley and it should be even more so with Thursday’s forecast, so I wouldn’t worry much about those splits.
At times Matthew Boyd was a savior for this rotation. He never actually lived up to his 3.21 ERA (3.65 FIP – 4.22 xFIP), but that’s still in the average to above average range. The problem is he was much better than that prior to his last seven starts (37 IP – 25 R – 10 K-BB% - 12.3% Barrels/BBE – 41.4 HardHit% - 6.08 ERA/5.38 FIP/5.59 xFIP.
Boyd struck out just two of 18 Padres he faced in the first Wild Card game, down half a mph and an inch of iVB on an already marginal fastball. He got just four swings and misses. He threw just 58 pitches, so Counsel brought him back for Game One of the NLDS. I suspected some shenanigans with Boyd being pulled quickly to get better matchups for whoever followed him. I was right about that, but for the wrong reason.
Boyd lasted just two outs because he got hammered for six runs (though only two were earned). He threw 30 pitches. The good news is that his fastball didn’t lose anything and he did generate four whiffs, but only another three called strikes.
Perhaps Boyd will be more successful on normal rest at home, but again, remember the way he finished the season. RHBs exceeded LHBs by more than 30 points with a .297 wOBA and .317 xwOBA against him. I’m projecting him to face just three LHBs tonight with an average 116 wRC+, but .128 ISO vs LHP for the entire lineup. The Brewers have raked (136 wRC+) in this series, while the Cubs (87) haven’t gotten too much going in five games of post-season play.
A later starting game than usual in Chicago, temperatures are expected to be in the upper 50s with a light wind blowing in from near the right field pole. This will make an already extremely negative run environment even more pitcher friendly. There is a bit of discrepancy for Lance Barksdale, as he generates a lot of unders in his career, but has a higher umpire ERA than most.
I have Peralta with a half run edge here with offenses fairly even when adding in Milwaukee’s 50 point post-season wRC+ edge, but heavily regressing it. I don’t have the bullpen gap at 1.5 runs, but the Milwaukee pen has certainly performed better than the Chicago one in the post-season and has the better overall talent (especially if Misiorowski is available). Both teams are great defensively (Cubs small edge) and on the base paths (Brewers small edge).
I end up with the road team a near -130 favorite (-115ish F5), which is very much aligned with the market at this time. Similar for a total right around seven.
Post-season bullpen stats below...

Tigers @ Mariners
Tarik Skubal ended the season with two starts against the Guardians and it’s certainly not his fault they’re in they lost the division (12 IP – 51 BF – 4 R – 2 ER – 1 HR (1 barrel) – 5 BB – 17 K – 17.3 SwStr% - 37.9 HardHit%). Among pitchers with 80 or more innings this season (so we remove the closers), Tarik Skubal led the majors with a 27.8 K-BB%. With only a 33 HardHit%, he doesn’t have a single estimator reaching 2.75. He’s the best pitcher in baseball until proven otherwise. Batters from either side of the plate were below a .275 wOBA.
Skubal, once again, dominated the Guardians to open up the Wild Card round, setting the Tigers up to move on. He struck out 14 over 7.2 innings of three hit baseball, allowing a single run. Ridiculously, his fastball (99.1 mph) was up 1.5 mph with increased spin, but maintained it’s 17 inch iVB. The pitch that was responsible for 12 of his astounding 26 whiffs though, was the changeup, thrown just 32 times.
By pure counting run value, Skubal’s changeup was the best pitch in the majors this season and that’s absolutely confirmed by pitch modeling (71 PB, 131 P+). It’s a pitch the Mariners were 10th best in the league against this year (0.25 wCH/C), but Skubal just throws his so much better than other pitchers. Add in the extremely negative run environment and Skubal struck out nine Mariners over seven more five hit innings in Game Two. He did allow two solo home runs to Jorge Polanco, accounting for the only damage. The heater was up only half a mph this time (98.1) with otherwise similar characteristics as his season rates. This time, Skubal’s 16 total whiffs were more evenly dispersed among his fastball (four), change (five) and slider (five).
Expect Skubal to face the same Seattle lineup, which averaged a healthy 115 wRC+ and .202 ISO vs LHP, but also a 22.7 K%, which increases at home.
George Kirby struck out 31 of his last 64 batters with a single walk to turn a relatively lost season into a 20.6 K-BB% in the end (actually a career best with 20.1% his lowest mark – CONSISTENCY!) and his career K-BB at home (22.5%) is 4.1 points higher than on the road. While Kirby’s 8.5% Barrels/BBE was right around his career mark (8.2%), his 43.9 HardHit% was a career worst and at least 50% in four of his last five starts. Not as much of a problem if he pitches to his normal home peripherals though.
Considering the contact profile, Kirby’s 3.85 xERA is his only estimator not at least half a run better than his 4.21 ERA with a .315 BABIP and 71.3 LOB%, neither of which are egregious, but combined are a bit worse than you would expect. LHBs had a .319 wOBA and .311 xwOBA against Kirby this year, while RHBs had a .279 wOBA, but .315 xwOBA. At home, those wOBAs drop to .302 and .239. The Tigers have shifted some parts around in their lineup, but it’s still the same personnel, averaging a 105 wRC+ and .176 ISO, but 24.3 K% vs RHP this year. The entire team has a 78 wRC+ this post-season.
Kirby struck out eight Tigers over five innings in Game One, he only walked one, but also allowed the big two-run home run to Kerry Carpenter, who everyone is now aware has five career home runs against Kirby. The sinker (97.1 mph) was up 0.9 mph with nearly 100 more revolutions of spin. The slider was responsible for nine of his 16 whiffs over 94 pitches with just 23.1% of his contact on the ground, not a big problem in this park, especially under tonight’s expected conditions. Tigers generated contact on just three-quarters of their swings in the strike zone against Kirby. I wouldn’t expect him to face Carpenter, who is now batting leadoff the last few days, a third time in this game, unless the Mariners are far ahead.
In the most negative run environment in baseball, we may end up with a closed roof with temperatures below 60 degrees. This makes the run environment even more negative (77 Park Run Factor Statcast 3-yr) and only happens around one-quarter of their games and absolutely crushes RH power, which goes from a 94 average home run factor with the roof open to 73 with it closed. Alan Porter is a fairly neutral umpire, maybe slightly hitter friendly if forced to choose a side, but not nearly enough to make a difference.
Skubal gets about a half run edge in this battle of studs with the Mariners gaining a lot of that back offensively, but then losing a good chunk of it defensively. Seattle has the superior bullpen and has been about one-third of a run better than Detroit in their small post-season samples, but that seems about right. The Tigers are the much better base running team.
Overall, that gets me to a near even evaluation with a slide edge to the Detroit side (-105ish), just a bit larger over the F5 (-115ish). At +118, that’s nearly an actionable edge for the home team, but not quite for me, as I look for larger post-season edges as teams tighten things up. Unfortunately, I’m very much aligned with a 5.5 run total and even 2.5 run F5.
For those craving action, the Phillies and Mariners are near plays tonight and games I would consider more strongly in the regular season, where I can trust pitcher usage and bullpen numbers a bit more. And that’s even with a strong manual adjustment to the Dodger bullpen. Otherwise, it’s just the total in the early Thursday game and I’ll be back for the AL/NLCS, unless we get another pair of NL road victories tonight.
Below, these last two graphics are pitch matchup ratings, explained here. It uses pitch frequencies and run values both for the pitcher and the opposing offense and then attempts to add in pitch modeling, which sometimes differs from actual results.
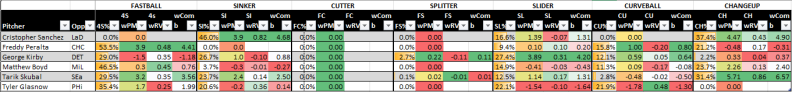
No cutters, huh?

LEGEND
Opp wRC+ Opposing offense’s wRC+ against L/RHP this season (in first graphic)
DEF Projected lineup(Roster Resource) Fielding Run Value & Team Runs Prevented now both in first graphic
Bullpen SIERA/xFIP/FIP average over the last 30 days (because there’s so much bullpen turnover)
BSR: Projected Lineup Base Running Runs also in first graphic
Don’t hesitate to ask about anything else that’s unclear.
Follow @FreelanceBBall on Twitter and Bsky.app
Add comment
Comments